


Yirsandy Rodríguez
-
Posts
67 -
Joined
-
Last visited
Content Type
Profiles
News
New York Mets Videos
2026 New York Mets Top Prospects Ranking
New York Mets Free Agent & Trade Rumors, Notes, & Tidbits
Guides & Resources
The New York Mets Players Project
2026 New York Mets Draft Tracker: Picks & Bonuses
Forums
Blogs
Events
Store
Downloads
Gallery
Everything posted by Yirsandy Rodríguez
-

A.J. Ewing's Summer Slump Is Both Multitudinous and Fixable
Yirsandy Rodríguez posted an article in Mets
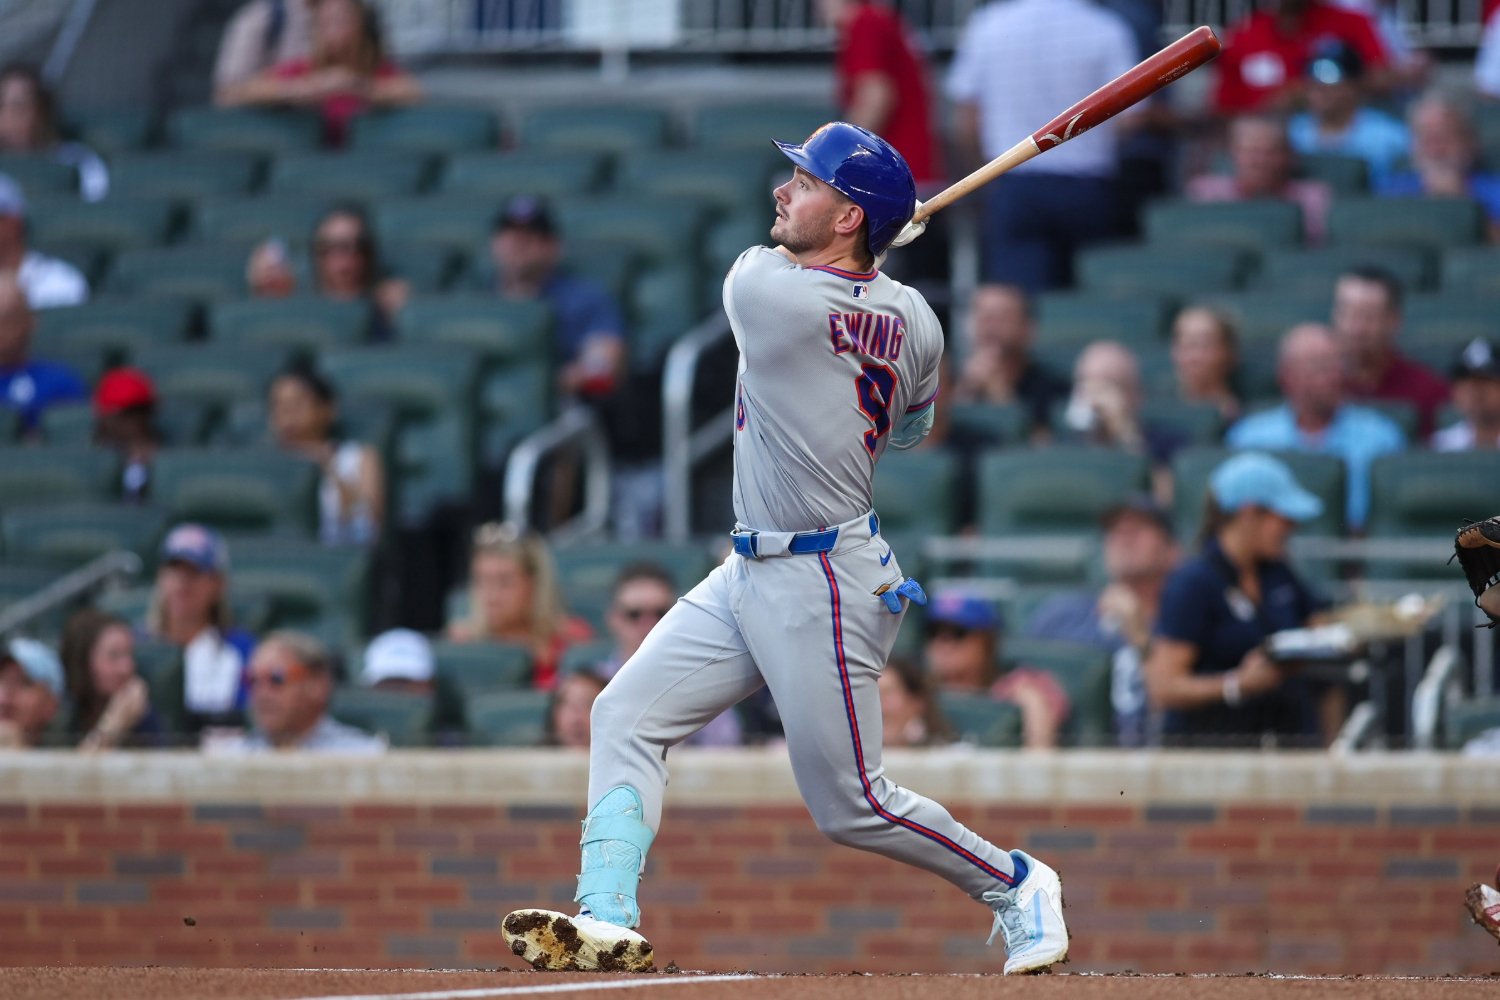 New York Mets rookie sensation A.J. Ewing has dropped to a 45 wRC+ in August, and though that might look like a reasonable slump for a rookie, the struggles actually began in July. After recording 1.0 fWAR and producing a 119 wRC+ between May and June, he has plummeted to a 74 wRC+ since last month. So, let's analyze what we should really worry about regarding the two versions of Ewing we have seen. Curiously, both halves of our sample consist of exactly 177 plate appearances each. Period WAR wRC+ O-Swing% Z-Swing% xBA xSLG Barrel% IdealAtkAng% MAY-JUNE 1.0 119 28.1% 63.4% .278 .426 6.3% 37.4% JULY-AUGUST 0.3 74 30.1% 71.0% .238 .388 9.8% 44.4% DIFFERENCES -0.7 -45 +2.0% +7.6% -.040 -.038 +3.5% +7.0% At first glance, two results stand out: Ewing is producing less, but several metrics show that he is making better contact. His Barrel% has increased by 3.5 percentage points, his ideal attack angle rate has also shown a very interesting improvement, and he has increased his swings at pitches inside the strike zone. Now, the concerning part is that Ewing has not been able to convert those improvements into actual results. And clearly, much of the problem has intensified during this month. Here are two key reasons: the drop in his power against fastballs, and his swing-and-miss rates against breaking balls. A.J. Ewing vs. fastballs Metric August 2026 xBA .311 .283 xSLG .233 .458 xwOBA .379 .367 Whiffs% 6.7% 15.1% Ewing has made a great improvement by reducing his whiff rate by 8.4 percentage points, but his drop from .458 to .233 in xSLG has been terrible. He is making contact, but pitchers are considerably limiting his impact. Here, you can see where the problem is concentrated inside and outside the strike zone. In nine of the 12 zones, his slugging has been almost nonexistent, especially up and on the inner half of the zone. Exit velocities haven't been the issue, but rather where a large portion of those balls in play are going. Those exit velocities in the strike zone have been great, but the location of the batted balls has stopped presenting a threat. This part of Ewing's problem ties into his struggles against breaking balls. Unlike the lack of production against fastballs, this month he is producing the best xSLG (.578) and highest average exit velocity (94.4) against any pitch group this year. However, his swing-and-miss issues have climbed back to their peak (38.2% whiff rate), just like they did in June. This trend becomes even more dangerous as pitchers succeed in neutralizing Ewing's impact against fastballs, and breaking pitches have once again caused his put-away rate (i.e., rate of being struck out on two-strike counts) to spike (25.9%). Let's analyze this interesting comparison here. On the left are Ewing's whiff rates during May and June against breaking pitches, while the right side shows the results from July to the present. Stability in the upper part of the zone has been maintained, but whiffs spiked in the lower zones and the outer edges. In short, pitchers are finishing at-bats against Ewing with more high fastballs and plenty of breaking pitches down, especially away. His season-long xSLG against fastballs leaves some hope if he manages to make adjustments to hit more consistently toward the pull side, but his situation against breaking balls poses a bigger problem. If he connects, Ewing destroys them. Too often, though, he fails to make contact at all. So, a large part of his struggles from July until now could turn around if he improves his swing selection. At just 22 years old, Ewing has shown enough talent to keep this slump from turning into a major problem. Seeing how he works to make adjustments to this newfound, exploitable weakness down this final stretch of the campaign will be one of the most interesting storylines within the Mets' disastrous season.
 -
Image courtesy of © Vincent Carchietta-Imagn Images The New York Mets will have many questions to answer after the disaster of this season, but they will also have important decisions to make. One of them will be deciding what they will do with backup catcher Luis Torrens, who appeared in some rumors of a possible trade during the trade deadline. Since arriving in New York in 2024, Torrens has fulfilled his role, especially on defense. This year, he ranks fourth in the league with +5 Catcher Framing Runs. When Torrens is behind the plate, Mets pitchers have posted their best ERA (3.63), and their opponents have produced a .234/.313/.374 slash line, the best mark of all catchers on the roster. Over the years, his offensive profile has been very different, from the player who hit 13 home runs and posted a 101 wRC+ with the Seattle Mariners in 2021 to the catcher with a .629 OPS a year ago. It is also worth keeping in mind that he has not been able to get enough playing time as a starter and has not played more than 100 games since that 2021 season. For any player, having to make continuous adjustments while taking on a backup role is a major challenge. However, this season, Torrens has made an interesting improvement in every aspect. By nature, his swing continues to stand out against fastballs, and he has an interesting profile against left-handed pitchers. Handedness wRC+ Hard% IdealAngle% xSLG Barrel% v L 120 32.0% 56.3% .346 10.7% v R 78 32.1% 49.0% .348 6.8% The big difference is his 120 wRC+ against left-handers, but overall, he has a good balance against both profiles. After an inconsistent start at the plate during the first half of the season, Torrens has made a significant turnaround after the All-Star Game. His wRC+ has risen from 69 to 180 in the second half of the season, and he has posted a 1.20 BB/K rate for the first time in his career. The only Mets hitter with more fWAR than Torrens (0.8) during this stretch has been Francisco Lindor (1.2). Even more interesting in this offensive resurgence is seeing how Torrens is expanding the impact of his swing across the strike zone. Although his O-Swing% rate (31.2) is the highest since 2023 (38.6), when pitchers throw him pitches inside the strike zone, he is producing the highest contact rate of his career (87.9). The most revealing adjustment in this new approach from Torrens appears when we look at how his swing is impacting six of the eight areas of the strike zone against fastballs. Let’s compare that sample with 2021, when Torrens hit 13 home runs with the Mariners. 2021 Torrens 2026 Torrens He recorded all of his home runs in the upper two-thirds of the zone. But this season, in what we could call an updated version, Torrens has more reach and fewer limitations within the strike zone. Combined with his defensive gains since arriving in New York, this is now the most valuable version of him we've ever seen—his 1.8 fWAR in 2026 has set a new career high. You never know what the Mets’ next move will be, but it seems reasonable that Francisco Álvarez (115 wRC+) and Torrens should be part of the future plans. As a backup, Torrens has actually outproduced the 1.7 fWAR Álvarez has contributed this year, offsetting his offensive flaws with elite defense that makes him one of the league's best backup catchers. View full article
-
Luis Torrens Has Morphed Into Baseball's Best Backup Catcher
Yirsandy Rodríguez posted an article in Mets
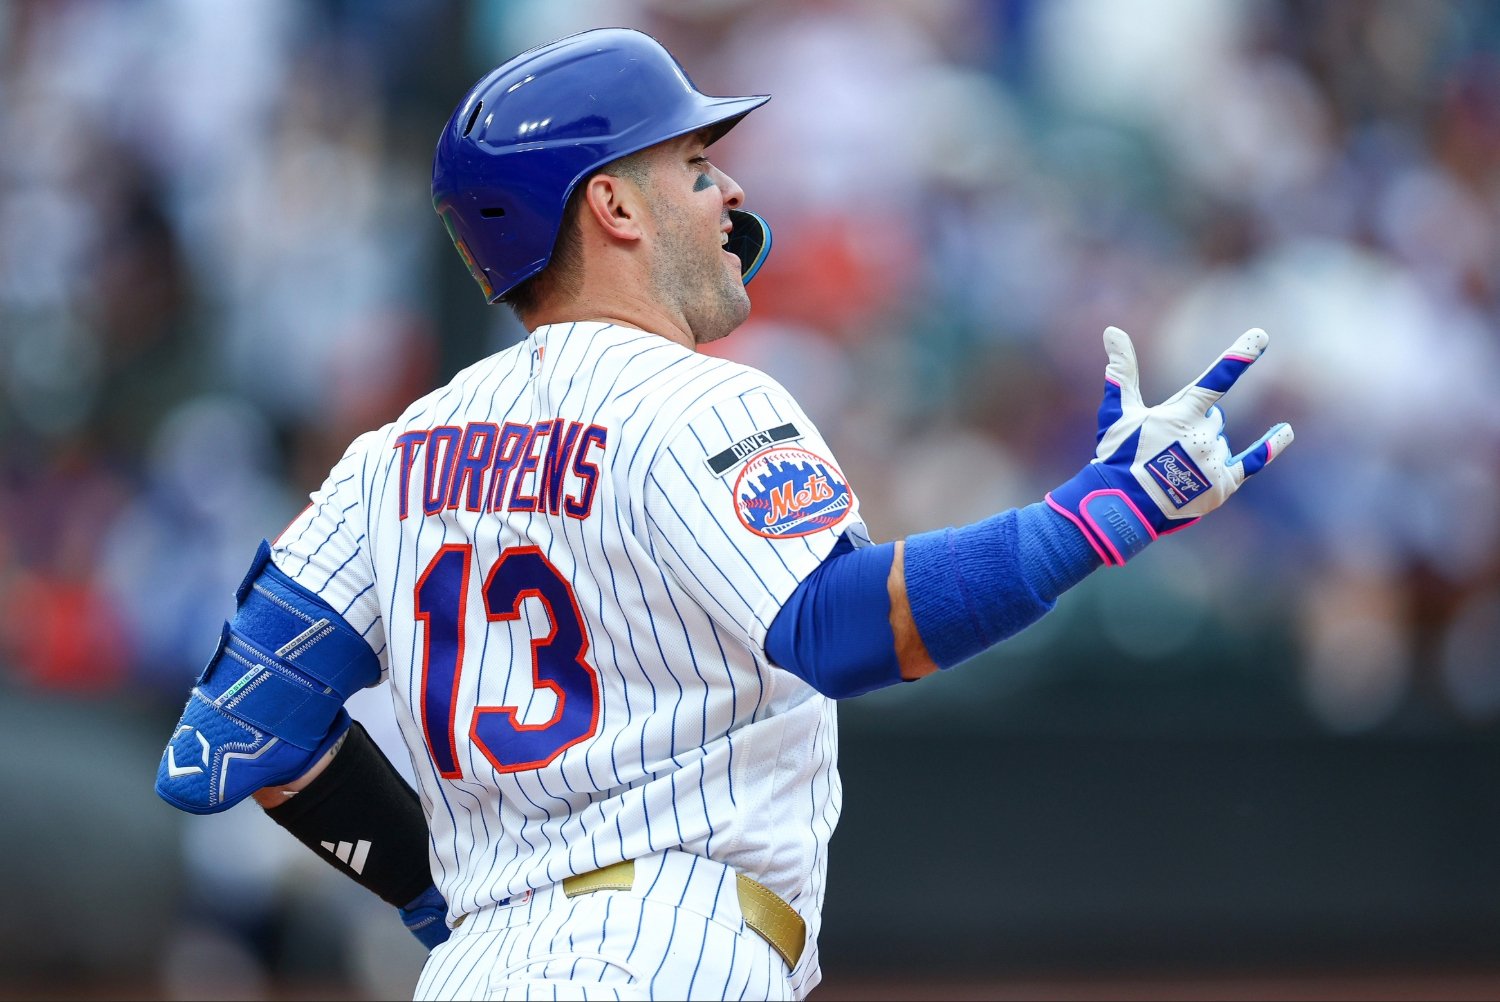 The New York Mets will have many questions to answer after the disaster of this season, but they will also have important decisions to make. One of them will be deciding what they will do with backup catcher Luis Torrens, who appeared in some rumors of a possible trade during the trade deadline. Since arriving in New York in 2024, Torrens has fulfilled his role, especially on defense. This year, he ranks fourth in the league with +5 Catcher Framing Runs. When Torrens is behind the plate, Mets pitchers have posted their best ERA (3.63), and their opponents have produced a .234/.313/.374 slash line, the best mark of all catchers on the roster. Over the years, his offensive profile has been very different, from the player who hit 13 home runs and posted a 101 wRC+ with the Seattle Mariners in 2021 to the catcher with a .629 OPS a year ago. It is also worth keeping in mind that he has not been able to get enough playing time as a starter and has not played more than 100 games since that 2021 season. For any player, having to make continuous adjustments while taking on a backup role is a major challenge. However, this season, Torrens has made an interesting improvement in every aspect. By nature, his swing continues to stand out against fastballs, and he has an interesting profile against left-handed pitchers. Handedness wRC+ Hard% IdealAngle% xSLG Barrel% v L 120 32.0% 56.3% .346 10.7% v R 78 32.1% 49.0% .348 6.8% The big difference is his 120 wRC+ against left-handers, but overall, he has a good balance against both profiles. After an inconsistent start at the plate during the first half of the season, Torrens has made a significant turnaround after the All-Star Game. His wRC+ has risen from 69 to 180 in the second half of the season, and he has posted a 1.20 BB/K rate for the first time in his career. The only Mets hitter with more fWAR than Torrens (0.8) during this stretch has been Francisco Lindor (1.2). Even more interesting in this offensive resurgence is seeing how Torrens is expanding the impact of his swing across the strike zone. Although his O-Swing% rate (31.2) is the highest since 2023 (38.6), when pitchers throw him pitches inside the strike zone, he is producing the highest contact rate of his career (87.9). The most revealing adjustment in this new approach from Torrens appears when we look at how his swing is impacting six of the eight areas of the strike zone against fastballs. Let’s compare that sample with 2021, when Torrens hit 13 home runs with the Mariners. 2021 Torrens 2026 Torrens He recorded all of his home runs in the upper two-thirds of the zone. But this season, in what we could call an updated version, Torrens has more reach and fewer limitations within the strike zone. Combined with his defensive gains since arriving in New York, this is now the most valuable version of him we've ever seen—his 1.8 fWAR in 2026 has set a new career high. You never know what the Mets’ next move will be, but it seems reasonable that Francisco Álvarez (115 wRC+) and Torrens should be part of the future plans. As a backup, Torrens has actually outproduced the 1.7 fWAR Álvarez has contributed this year, offsetting his offensive flaws with elite defense that makes him one of the league's best backup catchers.
 -
Image courtesy of © Jordan Godfree-Imagn Images Let’s admit it from the start: missing an entire year because of elbow surgery is rarely the recipe for returning to the major leagues as a more dangerous pitcher. The usual narrative demands that a pitcher come back completely healthy with a rebuilt elbow, throwing as hard as ever, or that he struggles while trying to regain the feel in his fingers. Christian Scott did neither. At 27, the New York Mets' right-hander returned to the mound in 2026 averaging the same 95.5 mph with his four-seam fastball and showing the same 6.9 feet of extension he had during his debut. The radar guns saw no difference. Hitters, however, are feeling it every time they step into the box. How does a starter with the same velocity go from a 4.54 FIP in 2024 to a 3.28 FIP while carrying a strikeout rate approaching 29%? The answer isn’t in his arm. It’s in the sequencing. Rather than chasing velocity, Scott changed the way hitters read his pitches. During his first MLB season, facing Scott was, at times, a fairly simple equation for an established hitter. He threw his four-seam fastball more than 52% of the time. It had good velocity and ride, but without enough late movement—and with such heavy reliance on the pitch—hitters could identify its trajectory and adjust their swings. The result was predictable: opponents produced perfect contact 23% of the time and whiffed on just 21.4% of their swings against the fastball. To survive as a high-level starter after an elbow rehabilitation, Scott needed that same fastball to become dangerous again. To make that happen, he had to change what happened before the ball reached the catcher’s glove. That’s where the metamorphosis of his sweeper comes in. Early in his career, Scott’s slider had horizontal movement but lacked the bite needed to consistently miss bats, with 13.2 inches of horizontal break, below the league average. In 2026, Scott added more than three inches of sweep. His sweeper now moves 16.6 inches toward the glove side, 2.3 inches above the league average, and carries a 113 Stuff+. That change in horizontal break disrupts the hitter’s visual read. When the ball leaves Scott’s hand, the hitter sees a trajectory that appears to be heading into the strike zone, only for the late sweep to pull it outside the bat’s reach. The impact on the field was immediate: the whiff rate on the sweeper jumped from 21.3% to 32.2%, while perfect contact dropped to just 11%. Metric 2024 2026 Horizontal Break 13.2" 16.6" (+2.3" vs. Avg.) Whiff Rate 21.30% 32.20% Perfect Contact % 16.00% 11.00% Stuff+ 110 113 But a sweeper doesn’t work in a vacuum. If a hitter knows there are only two speeds and two planes—a fastball up and a sweeper away—eventually he can sit on one of them. Scott needed a bridge, a pitch that would keep hitters from anticipating the point of contact. That’s why he added the cutter. A pitch he threw only twice in 2024 now accounts for 16.6% of his arsenal, with 226 pitches averaging 89.6 mph. Scott’s cutter isn’t designed to generate strikeouts; its 21.2% whiff rate is modest. Its job is to neutralize. By tightening the pitch toward hitters’ hands, Scott takes away their comfort at the plate. They can’t simply turn toward the outside edge expecting the sweeper or stay back waiting for the fastball, because the cutter breaks their bats in on the handle. It has allowed just 15% perfect contact rate and carries a .283 xwOBA against. This is where the chain of cause and effect closes the loop: the four-seam fastball came back to life without gaining a single mile per hour. Because hitters now have to protect both sides of the plate against two pitches with different horizontal movement, their reactions to Scott’s 95.5 mph fastball have become late. The whiff rate against the fastball climbed from 21.4% to 28.1%. Even more revealing, Baseball Savant’s Bat POV data shows that 57% of swings against his fastball finish below the center of the ball. Hitters are late, underneath the pitch, and either produce harmless fly balls or swing through it at the top of the zone. Scott still has details to clean up. His walk rate has risen to nearly 10.0%, and allowing so much air contact makes him vulnerable when the ball leaves the park at Citi Field, where he has allowed a 39.0% Hard-Hit rate compared with 29.9% on the road. We’re not talking about an established Cy Young contender or a finished product. But the point of baseball isn't waiting for a player to become perfect before trying to understand what he is doing. In the middle of a disastrous season in Queens, after the roster dismantling at the trade deadline, finding certainty on the mound is worth its weight in gold. View full article
-
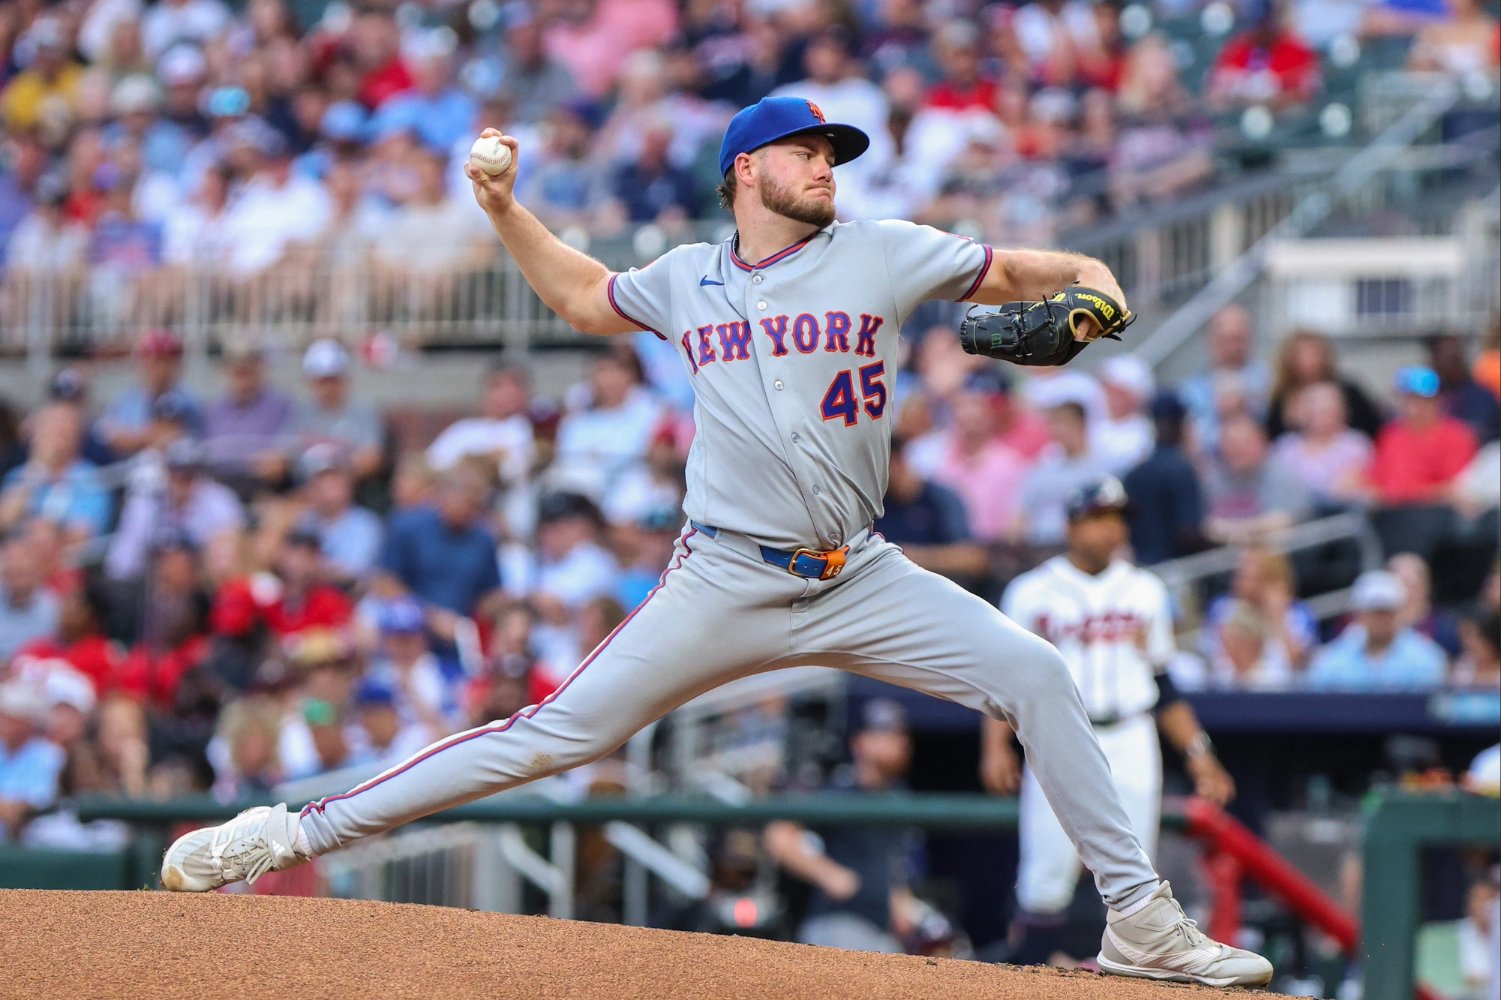 Let’s admit it from the start: missing an entire year because of elbow surgery is rarely the recipe for returning to the major leagues as a more dangerous pitcher. The usual narrative demands that a pitcher come back completely healthy with a rebuilt elbow, throwing as hard as ever, or that he struggles while trying to regain the feel in his fingers. Christian Scott did neither. At 27, the New York Mets' right-hander returned to the mound in 2026 averaging the same 95.5 mph with his four-seam fastball and showing the same 6.9 feet of extension he had during his debut. The radar guns saw no difference. Hitters, however, are feeling it every time they step into the box. How does a starter with the same velocity go from a 4.54 FIP in 2024 to a 3.28 FIP while carrying a strikeout rate approaching 29%? The answer isn’t in his arm. It’s in the sequencing. Rather than chasing velocity, Scott changed the way hitters read his pitches. During his first MLB season, facing Scott was, at times, a fairly simple equation for an established hitter. He threw his four-seam fastball more than 52% of the time. It had good velocity and ride, but without enough late movement—and with such heavy reliance on the pitch—hitters could identify its trajectory and adjust their swings. The result was predictable: opponents produced perfect contact 23% of the time and whiffed on just 21.4% of their swings against the fastball. To survive as a high-level starter after an elbow rehabilitation, Scott needed that same fastball to become dangerous again. To make that happen, he had to change what happened before the ball reached the catcher’s glove. That’s where the metamorphosis of his sweeper comes in. Early in his career, Scott’s slider had horizontal movement but lacked the bite needed to consistently miss bats, with 13.2 inches of horizontal break, below the league average. In 2026, Scott added more than three inches of sweep. His sweeper now moves 16.6 inches toward the glove side, 2.3 inches above the league average, and carries a 113 Stuff+. That change in horizontal break disrupts the hitter’s visual read. When the ball leaves Scott’s hand, the hitter sees a trajectory that appears to be heading into the strike zone, only for the late sweep to pull it outside the bat’s reach. The impact on the field was immediate: the whiff rate on the sweeper jumped from 21.3% to 32.2%, while perfect contact dropped to just 11%. Metric 2024 2026 Horizontal Break 13.2" 16.6" (+2.3" vs. Avg.) Whiff Rate 21.30% 32.20% Perfect Contact % 16.00% 11.00% Stuff+ 110 113 But a sweeper doesn’t work in a vacuum. If a hitter knows there are only two speeds and two planes—a fastball up and a sweeper away—eventually he can sit on one of them. Scott needed a bridge, a pitch that would keep hitters from anticipating the point of contact. That’s why he added the cutter. A pitch he threw only twice in 2024 now accounts for 16.6% of his arsenal, with 226 pitches averaging 89.6 mph. Scott’s cutter isn’t designed to generate strikeouts; its 21.2% whiff rate is modest. Its job is to neutralize. By tightening the pitch toward hitters’ hands, Scott takes away their comfort at the plate. They can’t simply turn toward the outside edge expecting the sweeper or stay back waiting for the fastball, because the cutter breaks their bats in on the handle. It has allowed just 15% perfect contact rate and carries a .283 xwOBA against. This is where the chain of cause and effect closes the loop: the four-seam fastball came back to life without gaining a single mile per hour. Because hitters now have to protect both sides of the plate against two pitches with different horizontal movement, their reactions to Scott’s 95.5 mph fastball have become late. The whiff rate against the fastball climbed from 21.4% to 28.1%. Even more revealing, Baseball Savant’s Bat POV data shows that 57% of swings against his fastball finish below the center of the ball. Hitters are late, underneath the pitch, and either produce harmless fly balls or swing through it at the top of the zone. Scott still has details to clean up. His walk rate has risen to nearly 10.0%, and allowing so much air contact makes him vulnerable when the ball leaves the park at Citi Field, where he has allowed a 39.0% Hard-Hit rate compared with 29.9% on the road. We’re not talking about an established Cy Young contender or a finished product. But the point of baseball isn't waiting for a player to become perfect before trying to understand what he is doing. In the middle of a disastrous season in Queens, after the roster dismantling at the trade deadline, finding certainty on the mound is worth its weight in gold.
 -
Image courtesy of © Vincent Carchietta-Imagn Images Most of the conversations surrounding the New York Mets’ trade deadline have focused on names like Freddy Peralta, Brooks Raley, and A.J. Minter, the latter of whom has already been traded. However, Tyrone Taylor could become one of the more interesting options for teams looking to strengthen their outfield before October. Taylor does not have the same profile as other players available on the market, but he offers a combination that can be difficult to find. He is a right-handed outfielder capable of playing all three outfield positions, has experience in center field, and has been one of the Mets’ best hitters against left-handed pitchers this season. After a 2025 season that lowered his value, Taylor regained some of his offensive production and moved closer to the player he was during his time with the Milwaukee Brewers. His contract also works in favor of potential buyers: he will earn $3.8 million in 2026 and become a free agent after the season. Assessing Tyrone Taylor's Trade Market Taylor built his value away from the profile of an impact hitter. After making his debut with the Milwaukee Brewers, he earned a spot in the majors because of his athleticism and defensive ability in the outfield. His best season came in 2022, when he appeared in 120 games, accumulated 2.1 WAR and finished in the 81st percentile in Statcast defensive metrics. That season showed the profile that has defined his career: enough offensive production to stay in the lineup while creating value with his glove. The Mets acquired him before the 2024 season, and although his bat has had ups and downs in New York, his defense remains an important part of his role on the roster. The 2025 season was the lowest point of Taylor’s time with the Mets. He hit .223/.279/.319 with a 70 wRC+, while his barrel rate dropped to the 12th percentile and his expected slugging percentage fell to the 17th percentile. That season hurt his market value, but his rebound in 2026 has changed the conversation. In just over 150 plate appearances, Taylor is hitting .239/.289/.486 with nine home runs, a .246 ISO and a 113 wRC+. Taylor has also accumulated 20 Outs Above Average and 21 Defensive Runs Saved during his career in the outfield. He has played more than 2,000 innings in center field and also has experience in the corners, which is the kind of experience that every contender wants when they're looking to add a bench bat at the deadline. And though his defensive metrics have declined in a limited sample during 2026, he still has tools teams value. His sprint speed ranks in the 91st percentile this season, and his arm strength remains one of his best attributes, ranking in the 85th percentile. Another element that increases his appeal is his performance against left-handed pitching. Against lefties in 2026, Taylor is hitting .314/.324/.614 with a .938 OPS and a 156 wRC+. While that production would be difficult to maintain over a full season, it confirms the skill that has been one of the most valuable parts of his profile throughout his career. Because he is a rental player, the Mets should not expect a package similar to what they could receive for a player with multiple years of team control. But his combination of quality defense and production against left-handed pitching could allow New York to acquire a mid-level prospect or a younger player with big upside. View full article
-
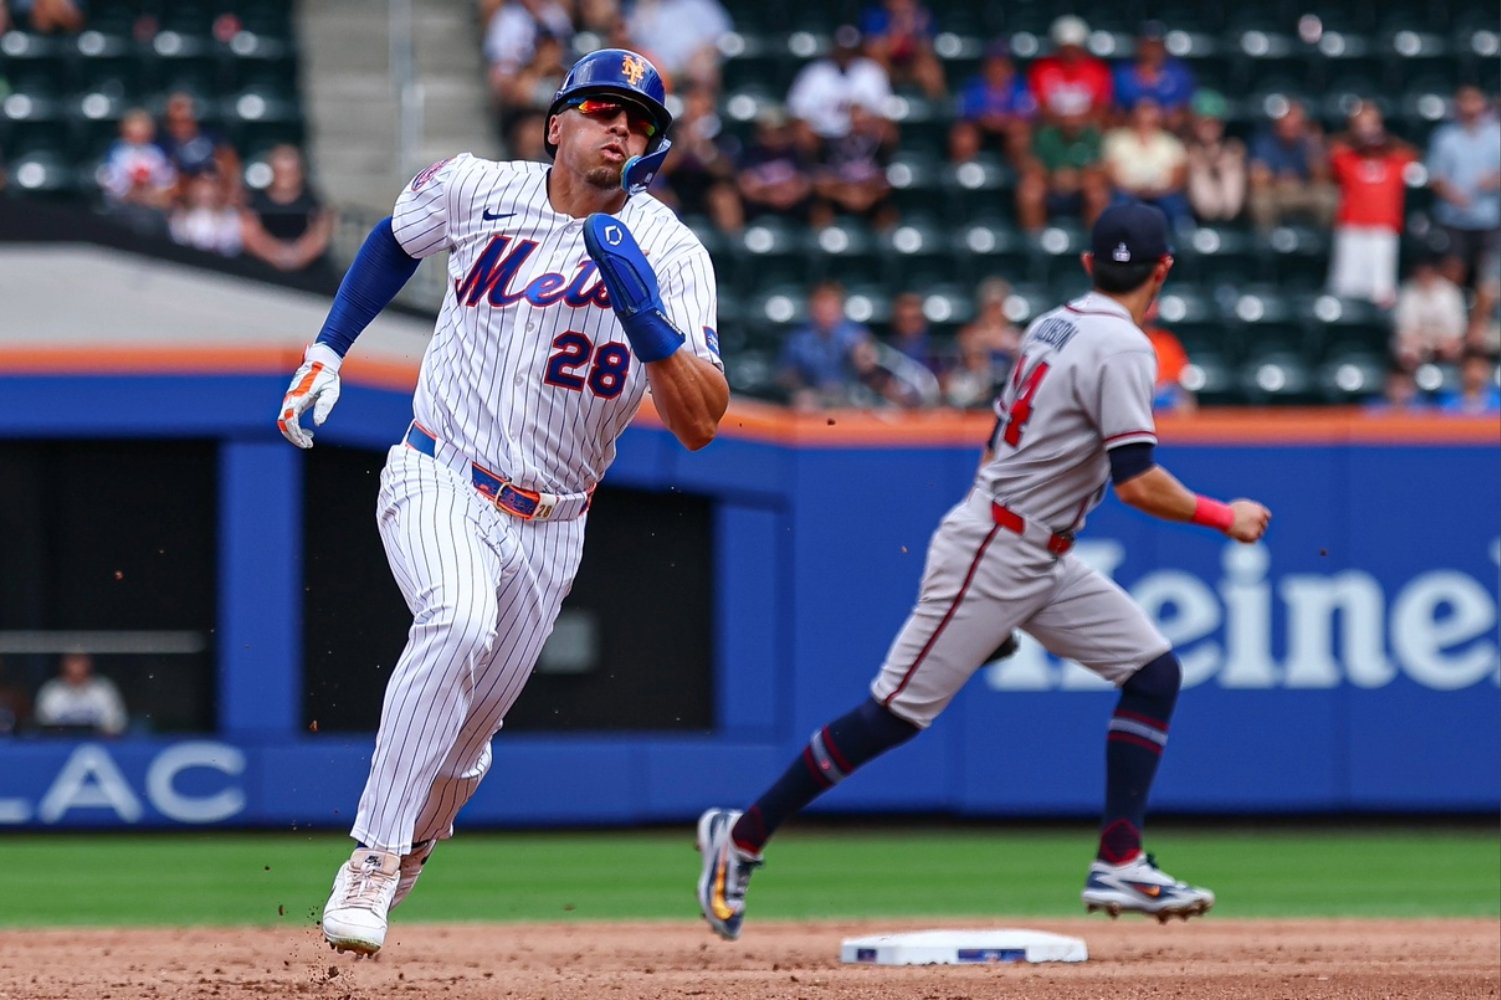 Most of the conversations surrounding the New York Mets’ trade deadline have focused on names like Freddy Peralta, Brooks Raley, and A.J. Minter, the latter of whom has already been traded. However, Tyrone Taylor could become one of the more interesting options for teams looking to strengthen their outfield before October. Taylor does not have the same profile as other players available on the market, but he offers a combination that can be difficult to find. He is a right-handed outfielder capable of playing all three outfield positions, has experience in center field, and has been one of the Mets’ best hitters against left-handed pitchers this season. After a 2025 season that lowered his value, Taylor regained some of his offensive production and moved closer to the player he was during his time with the Milwaukee Brewers. His contract also works in favor of potential buyers: he will earn $3.8 million in 2026 and become a free agent after the season. Assessing Tyrone Taylor's Trade Market Taylor built his value away from the profile of an impact hitter. After making his debut with the Milwaukee Brewers, he earned a spot in the majors because of his athleticism and defensive ability in the outfield. His best season came in 2022, when he appeared in 120 games, accumulated 2.1 WAR and finished in the 81st percentile in Statcast defensive metrics. That season showed the profile that has defined his career: enough offensive production to stay in the lineup while creating value with his glove. The Mets acquired him before the 2024 season, and although his bat has had ups and downs in New York, his defense remains an important part of his role on the roster. The 2025 season was the lowest point of Taylor’s time with the Mets. He hit .223/.279/.319 with a 70 wRC+, while his barrel rate dropped to the 12th percentile and his expected slugging percentage fell to the 17th percentile. That season hurt his market value, but his rebound in 2026 has changed the conversation. In just over 150 plate appearances, Taylor is hitting .239/.289/.486 with nine home runs, a .246 ISO and a 113 wRC+. Taylor has also accumulated 20 Outs Above Average and 21 Defensive Runs Saved during his career in the outfield. He has played more than 2,000 innings in center field and also has experience in the corners, which is the kind of experience that every contender wants when they're looking to add a bench bat at the deadline. And though his defensive metrics have declined in a limited sample during 2026, he still has tools teams value. His sprint speed ranks in the 91st percentile this season, and his arm strength remains one of his best attributes, ranking in the 85th percentile. Another element that increases his appeal is his performance against left-handed pitching. Against lefties in 2026, Taylor is hitting .314/.324/.614 with a .938 OPS and a 156 wRC+. While that production would be difficult to maintain over a full season, it confirms the skill that has been one of the most valuable parts of his profile throughout his career. Because he is a rental player, the Mets should not expect a package similar to what they could receive for a player with multiple years of team control. But his combination of quality defense and production against left-handed pitching could allow New York to acquire a mid-level prospect or a younger player with big upside.
 -
Image courtesy of © Dale Zanine-Imagn Images Freddy Peralta, A.J. Minter, and Brooks Raley have dominated the New York Mets' trade deadline conversation. But the reliever who may generate the strongest market is Huascar Brazobán. Several contenders have checked in on the veteran right-hander because he offers something few available relievers do. Brazobán can cover multiple innings, retire hitters from both sides of the plate, and he remains under team control beyond this season. While no advanced negotiations or specific destinations have been reported, his profile makes him one of the most valuable bullpen options available. It also helps that he's having the best season of his career thanks to some tweaks, and those adjustments have significantly increased his trade value as the Mets look to maximize their return before the Aug. 3 deadline. Mets Trade Candidates: Huascar Brazobán Few relievers who could be available at the deadline offer the type of profile Brazobán has built in 2026. Through 50⅔ innings, he owns a 2.66 ERA while holding opponents to a .169 batting average. More importantly, the underlying numbers support those results. His 2.82 xERA and 3.77 xFIP suggest this success is due to real improvement in the quality of his pitches. The biggest difference from last year is the contact hitters are making against him. After allowing more hard contact in 2025, Brazobán has taken a major step forward this season. He ranks in the 99th percentile in both hard-hit rate and barrel rate while also sitting among the league leaders in lowest average exit velocity allowed. Hitters are simply struggling to make any sort of impact against him in the box. The reasoning behind this improvement starts with his pitch mix. Brazobán has simplified his arsenal and leaned more heavily on the pitches that best fit his strengths. His sinker usage has increased from 36.7 percent in 2025 to 50.9 percent this season, while his four-seam fastball and cutter have become much smaller parts of his repertoire. The result is a more efficient approach that generates ground balls and limits damage, even when he is not missing bats. His changeup remains the ideal complement. The combination allows him to neutralize both right-handed and left-handed hitters, giving contenders another reason to view him as a valuable postseason bullpen option. The expected metrics reinforce that improvement. Brazobán ranks in the 92nd percentile in both xERA and xwOBA and in the 97th percentile in expected slugging percentage. He has also increased his ground-ball rate to 53.5 percent while allowing just 0.53 home runs per nine innings, two numbers that help explain why his performance looks sustainable. Need even more reason to believe in his results? Just take a look at his versatility. Throughout the season, Brazobán has handled traditional relief appearances, multi-inning outings, and even spot starts when needed. That flexibility gives potential buyers multiple ways to use him and expands the number of teams that could view him as a fit before the deadline. His contract status is the cherry on top, separating him from many of the other relievers expected to be available. While Minter and Raley profile as short-term rentals approaching free agency, Brazobán remains under team control for multiple seasons beyond 2026. He is not scheduled to become a free agent until after the 2029 season, giving an acquiring team value beyond the current playoff race and giving the Mets more leverage in trade discussions. The interest in Brazobán is already there. The question now is whether another club is willing to meet the Mets' asking price for a 36-year-old reliever with so much working in his favor. View full article
-
Evaluating Huascar Brazobán's Trade Value Ahead of Mets' Sell-Off
Yirsandy Rodríguez posted an article in Mets
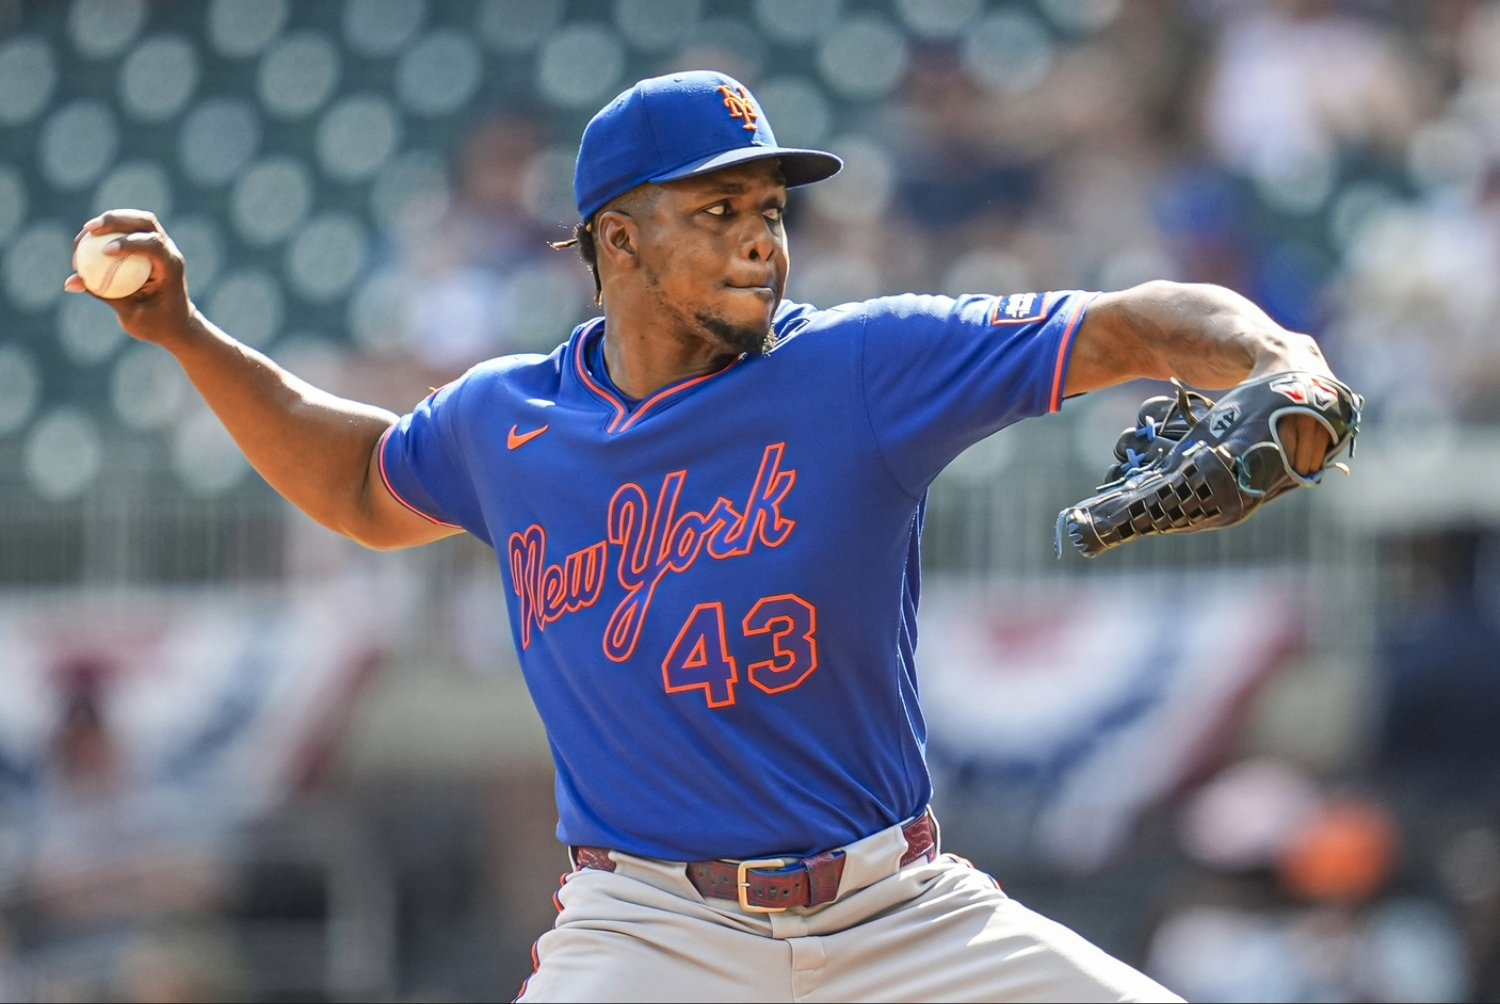 Freddy Peralta, A.J. Minter, and Brooks Raley have dominated the New York Mets' trade deadline conversation. But the reliever who may generate the strongest market is Huascar Brazobán. Several contenders have checked in on the veteran right-hander because he offers something few available relievers do. Brazobán can cover multiple innings, retire hitters from both sides of the plate, and he remains under team control beyond this season. While no advanced negotiations or specific destinations have been reported, his profile makes him one of the most valuable bullpen options available. It also helps that he's having the best season of his career thanks to some tweaks, and those adjustments have significantly increased his trade value as the Mets look to maximize their return before the Aug. 3 deadline. Mets Trade Candidates: Huascar Brazobán Few relievers who could be available at the deadline offer the type of profile Brazobán has built in 2026. Through 50⅔ innings, he owns a 2.66 ERA while holding opponents to a .169 batting average. More importantly, the underlying numbers support those results. His 2.82 xERA and 3.77 xFIP suggest this success is due to real improvement in the quality of his pitches. The biggest difference from last year is the contact hitters are making against him. After allowing more hard contact in 2025, Brazobán has taken a major step forward this season. He ranks in the 99th percentile in both hard-hit rate and barrel rate while also sitting among the league leaders in lowest average exit velocity allowed. Hitters are simply struggling to make any sort of impact against him in the box. The reasoning behind this improvement starts with his pitch mix. Brazobán has simplified his arsenal and leaned more heavily on the pitches that best fit his strengths. His sinker usage has increased from 36.7 percent in 2025 to 50.9 percent this season, while his four-seam fastball and cutter have become much smaller parts of his repertoire. The result is a more efficient approach that generates ground balls and limits damage, even when he is not missing bats. His changeup remains the ideal complement. The combination allows him to neutralize both right-handed and left-handed hitters, giving contenders another reason to view him as a valuable postseason bullpen option. The expected metrics reinforce that improvement. Brazobán ranks in the 92nd percentile in both xERA and xwOBA and in the 97th percentile in expected slugging percentage. He has also increased his ground-ball rate to 53.5 percent while allowing just 0.53 home runs per nine innings, two numbers that help explain why his performance looks sustainable. Need even more reason to believe in his results? Just take a look at his versatility. Throughout the season, Brazobán has handled traditional relief appearances, multi-inning outings, and even spot starts when needed. That flexibility gives potential buyers multiple ways to use him and expands the number of teams that could view him as a fit before the deadline. His contract status is the cherry on top, separating him from many of the other relievers expected to be available. While Minter and Raley profile as short-term rentals approaching free agency, Brazobán remains under team control for multiple seasons beyond 2026. He is not scheduled to become a free agent until after the 2029 season, giving an acquiring team value beyond the current playoff race and giving the Mets more leverage in trade discussions. The interest in Brazobán is already there. The question now is whether another club is willing to meet the Mets' asking price for a 36-year-old reliever with so much working in his favor.
 -
Image courtesy of © John Jones-Imagn Images There are pitchers capable of surviving even when one of their best pitches stops working. Tobias Myers never belonged to that group. His success in Milwaukee never depended on a single dominant pitch, but on the way five different pitches forced hitters to make a different decision on every offering. When that identity began to fade, so did the pitcher the Brewers had found. Two seasons later, that pitcher appears to have vanished. With the New York Mets, Myers has a 6.14 ERA and a 59.1% strand rate. His decline shows the collapse of a pitcher who lost the identity of his repertoire. Consider the batting line against right-handers: .363/.420/.638. Myers went from a .247 wOBA against righties in 2024 to .448 in 2026. Against lefties, he remains competent: .211 average, .248 OBP. The problem is that right-handed batters represent the majority of the hitters he sees, and Myers has no answers for them. What changed? In 2024, Myers threw five pitches: four-seam fastball, cutter, slider, changeup, and curveball. The key was not simply having five options. It was the way they complemented each other. The changeup was the pitch that tied the entire repertoire together. It forced batters to respect the bottom of the zone, made the fastball play above its velocity, and delayed slider recognition. Pitch Year AVG SLG SwStr% Vert. Mov. Hor. Mov. Changeup 2024 .083 .083 17.1% 7.3 -6.9 Splitter 2026 .179 .462 15.4% 5.2 -5.2 In 2026, Myers has replaced the changeup with a splitter. Unlike the changeup, the splitter has less vertical and horizontal separation and stays in the swing plane longer. That difference reduces the deception that once sustained the repertoire. The results reflect that difference: a .179 batting average against, a .462 slugging percentage, and a 27.3% HR/FB rate. Mistakes with the splitter have been punished. Myers's slider has also changed. In 2024, it averaged 85.5 mph, generated swings and misses 12.6% of the time, and held batters to a .196 average. In 2026, his slider averages 82.1 mph. Metric 2024 2026 Change Velocity 85.5 mph 82.1 mph -3.4 mph SwStr% 12.6% 6.9% -5.7 percentage points AVG .196 .333 +.137 wOBA .212 .429 +.217 The velocity loss did not merely reduce swings and misses. It also reduced the visual overlap between the fastball and the slider. With less separation between the two, hitters have more time to recognize the spin, adjust the swing, and make a decision they previously had to resolve much earlier. Myers's xERA (4.41) is better than his ERA (6.14). Some of the inflated ERA reflects poor fortune in high-leverage situations. But that does not explain everything; the contact he's surrendering is also a massive issue. Average exit velocity against Myers rose from 89.7 mph in 2024 to 91.6 mph in 2026. His hard-hit rate climbed from 31.4% to 45.8%. What's behind that jump? As someone with a deep arsenal, Myers has always been more of a command-and-sequencing pitcher. His Location+ in 2024 was 102. His Stuff+ was 91. Now, that relationship has flipped, with a Stuff+ of 103 but a Location+ of 98. He simply can't get hitters out with regularity these days, giving up at least one run in 10 of his last 12 appearances. His demotion to the minors was a necessary step in getting him right, but the pitcher the Mets thought they acquired from the Brewers is deeply broken right now. View full article
-
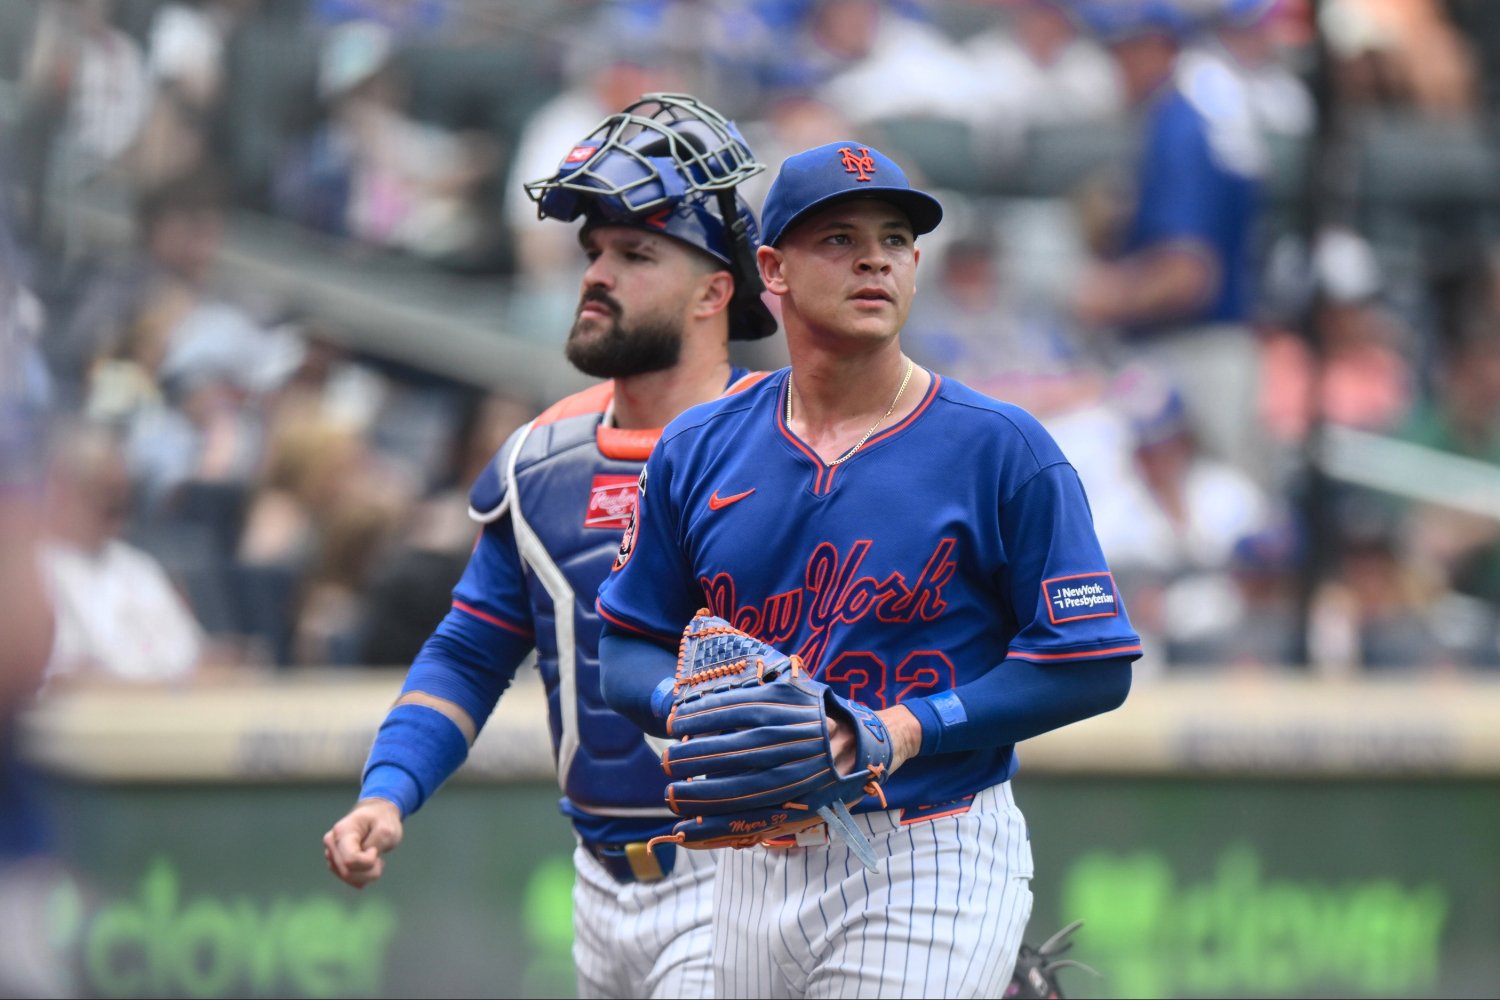 There are pitchers capable of surviving even when one of their best pitches stops working. Tobias Myers never belonged to that group. His success in Milwaukee never depended on a single dominant pitch, but on the way five different pitches forced hitters to make a different decision on every offering. When that identity began to fade, so did the pitcher the Brewers had found. Two seasons later, that pitcher appears to have vanished. With the New York Mets, Myers has a 6.14 ERA and a 59.1% strand rate. His decline shows the collapse of a pitcher who lost the identity of his repertoire. Consider the batting line against right-handers: .363/.420/.638. Myers went from a .247 wOBA against righties in 2024 to .448 in 2026. Against lefties, he remains competent: .211 average, .248 OBP. The problem is that right-handed batters represent the majority of the hitters he sees, and Myers has no answers for them. What changed? In 2024, Myers threw five pitches: four-seam fastball, cutter, slider, changeup, and curveball. The key was not simply having five options. It was the way they complemented each other. The changeup was the pitch that tied the entire repertoire together. It forced batters to respect the bottom of the zone, made the fastball play above its velocity, and delayed slider recognition. Pitch Year AVG SLG SwStr% Vert. Mov. Hor. Mov. Changeup 2024 .083 .083 17.1% 7.3 -6.9 Splitter 2026 .179 .462 15.4% 5.2 -5.2 In 2026, Myers has replaced the changeup with a splitter. Unlike the changeup, the splitter has less vertical and horizontal separation and stays in the swing plane longer. That difference reduces the deception that once sustained the repertoire. The results reflect that difference: a .179 batting average against, a .462 slugging percentage, and a 27.3% HR/FB rate. Mistakes with the splitter have been punished. Myers's slider has also changed. In 2024, it averaged 85.5 mph, generated swings and misses 12.6% of the time, and held batters to a .196 average. In 2026, his slider averages 82.1 mph. Metric 2024 2026 Change Velocity 85.5 mph 82.1 mph -3.4 mph SwStr% 12.6% 6.9% -5.7 percentage points AVG .196 .333 +.137 wOBA .212 .429 +.217 The velocity loss did not merely reduce swings and misses. It also reduced the visual overlap between the fastball and the slider. With less separation between the two, hitters have more time to recognize the spin, adjust the swing, and make a decision they previously had to resolve much earlier. Myers's xERA (4.41) is better than his ERA (6.14). Some of the inflated ERA reflects poor fortune in high-leverage situations. But that does not explain everything; the contact he's surrendering is also a massive issue. Average exit velocity against Myers rose from 89.7 mph in 2024 to 91.6 mph in 2026. His hard-hit rate climbed from 31.4% to 45.8%. What's behind that jump? As someone with a deep arsenal, Myers has always been more of a command-and-sequencing pitcher. His Location+ in 2024 was 102. His Stuff+ was 91. Now, that relationship has flipped, with a Stuff+ of 103 but a Location+ of 98. He simply can't get hitters out with regularity these days, giving up at least one run in 10 of his last 12 appearances. His demotion to the minors was a necessary step in getting him right, but the pitcher the Mets thought they acquired from the Brewers is deeply broken right now.
 -
Image courtesy of © Dale Zanine-Imagn Images Bo Bichette went from problem to solution in one month. In May, he hit .207. In June, .321. His OPS jumped from .576 to .883. He did it while posting baseball's highest chase rate (44.8% O-Swing%). The question: Is an aggressive, contact-oriented approach the optimal strategy for a hitter with Bichette's exceptional bat-to-ball skills? Bichette has always been aggressive. His career O-Swing% sits at 37.1%, well above the league average. But he's made a career on turning difficult pitches into quality contact at a rate few hitters can match. His career O-Contact% has remained above league average. For much of his career, he has ranked among the best qualified hitters in baseball in that category. A hitter can be aggressive without sacrificing plate discipline. At his best—most notably during his 2025 season, when he posted a 134 wRC+—Bichette paired aggression with selectivity. He chased pitches, but his O-Swing% was 35.2%. When he chased, he made contact. To understand why this strategy works, look at how Bichette changed from month to month. Month O-Swing% O-Contact% Z-Swing% Z-Contact% Swing% Contact% K% BB% Mar/Apr 40.9% 72.4% 69.7% 90.4% 54.7% 83.4% 19.9% 5.9% May 35.4% 79.8% 66.8% 94.3% 50.2% 88.9% 12.3% 9.0% June 44.8% 56.6% 68.6% 90.7% 55.7% 75.9% 23.9% 2.6% In May, Bichette found the sweet spot. He chased less and made more contact when he did. His strikeout rate dropped to 12.3%, while his walk rate climbed to 9.0%. It was the version of Bichette that had made him so productive in previous seasons: aggressive, but controlled. Then, June arrived. His O-Swing% jumped 9.4 percentage points. His O-Contact% collapsed by more than 23 points. He went from missing two out of every ten swings at pitches outside the zone to missing more than four. His strikeout rate nearly doubled, while his walk rate fell to less than one-third of its May level. Yet his production improved. His ISO rose from .090 to .220. His slugging percentage jumped from .297 to .541. He hit five home runs in June after hitting only three in May. Month Blast Contact% Squared-Up Contact% Barrel/BBE% Attack Angle Ideal Attack Angle% HardHit% EV May 14.1% 31.6% 11.5% 2° 24.0% 42.7% 90.4 June 17.0% 35.2% 6.0% 4° 31.1% 43.4% 91.2 Blast Contact and Squared-Up Contact describe how well the ball was struck when contact occurred. Barrel/BBE measures how often batted balls reached the specific combination of exit velocity and launch angle that Statcast classifies as barrels. In June, Bichette improved both his Blast Contact and Squared-Up Contact rates. When he made contact, he hit the ball harder and found the sweet spot more often. The problem was that he made contact far less often. His Whiff% jumped from 11.6% to 26.8%. While some indicators of contact quality improved, that improvement did not translate into a higher barrel rate. His Barrel/BBE fell from 11.5% to 6.0%, suggesting that the gains in contact quality were neither uniform nor complete across the various dimensions measured by Statcast. There was also a change in his batted-ball profile. His average Attack Angle increased from 2 degrees to 4 degrees, while his Ideal Attack Angle% climbed from 24.0% to 31.1%. He elevated the ball, helping explain the power surge. That adjustment was real, but it came with a broader deterioration in the rest of his offensive profile. His ability to put the ball in play declined. His strikeouts increased. His walks disappeared. The improvements in certain contact-quality metrics arrived alongside a decline in the underlying process. His .380 BABIP, well above his career mark of .334, points to good fortune. His .299 expected batting average versus an actual .321 average indicates that the quality of contact justified much of the production, but not all. Which brings us back to the original question. What June demonstrated is that Bichette has a larger margin for error than most hitters. His bat-to-ball ability gives him that margin. Few hitters could survive that process for a month and still produce. But surviving is not the same thing as sustaining. For one month, Bichette drifted toward a three-outcome profile: more strikeouts, few walks, and damage whenever he managed to make contact. That is not the profile on which he built his career, nor the profile that best leverages his greatest strength. The evidence points to one conclusion: an aggressive approach can work for Bichette, but only as long as aggression doesn't become an unchecked chasing habit. View full article
-
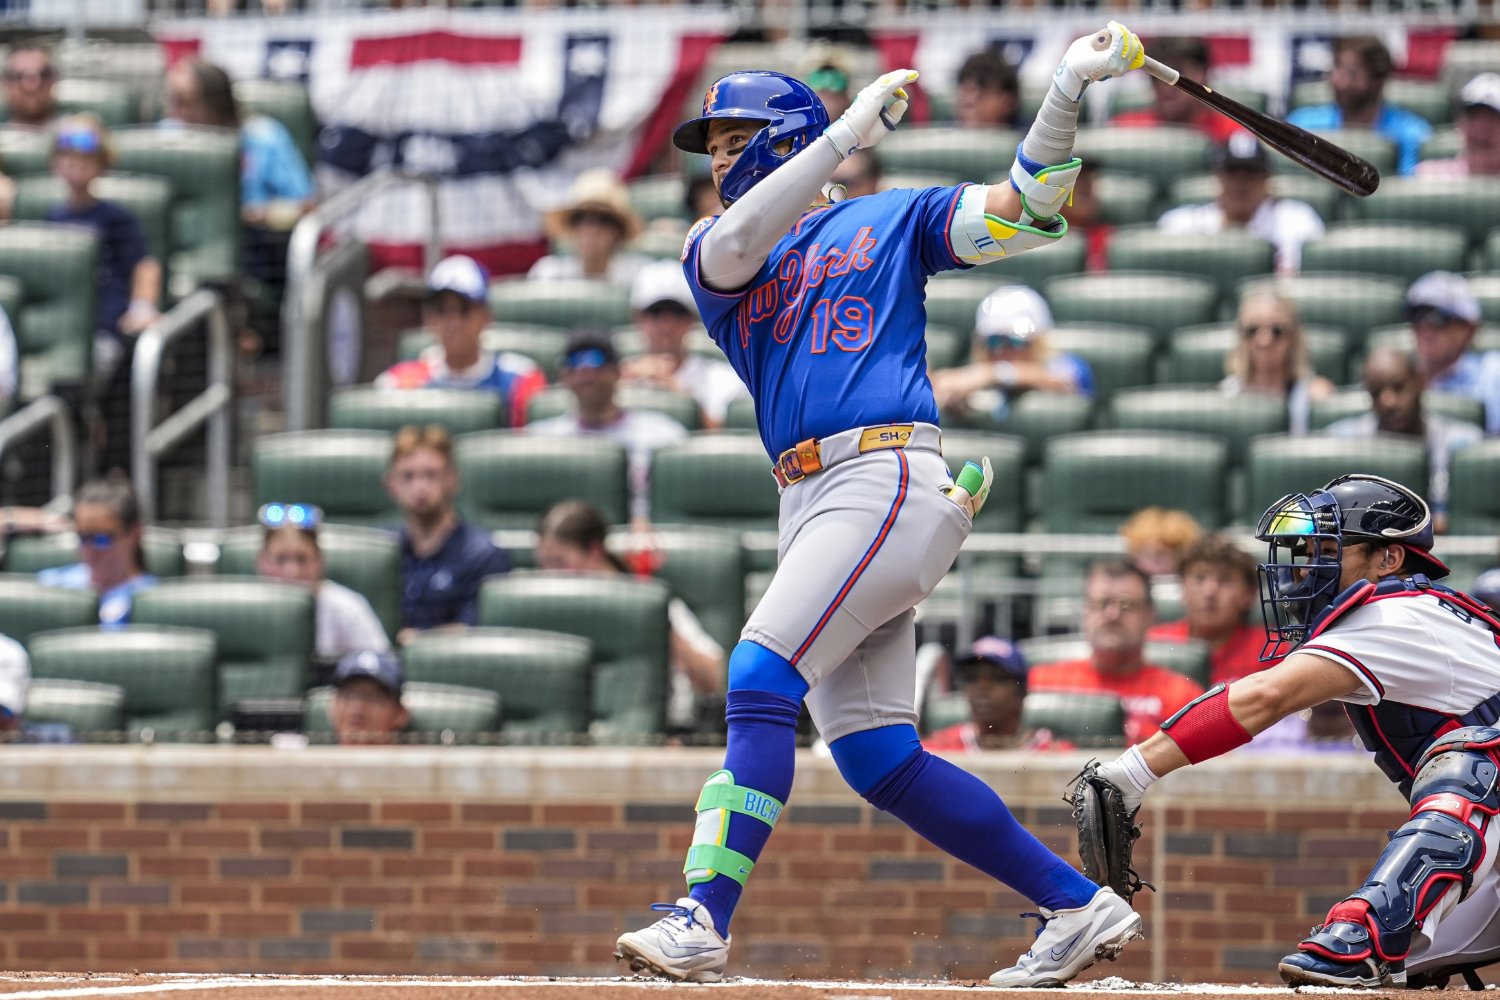 Bo Bichette went from problem to solution in one month. In May, he hit .207. In June, .321. His OPS jumped from .576 to .883. He did it while posting baseball's highest chase rate (44.8% O-Swing%). The question: Is an aggressive, contact-oriented approach the optimal strategy for a hitter with Bichette's exceptional bat-to-ball skills? Bichette has always been aggressive. His career O-Swing% sits at 37.1%, well above the league average. But he's made a career on turning difficult pitches into quality contact at a rate few hitters can match. His career O-Contact% has remained above league average. For much of his career, he has ranked among the best qualified hitters in baseball in that category. A hitter can be aggressive without sacrificing plate discipline. At his best—most notably during his 2025 season, when he posted a 134 wRC+—Bichette paired aggression with selectivity. He chased pitches, but his O-Swing% was 35.2%. When he chased, he made contact. To understand why this strategy works, look at how Bichette changed from month to month. Month O-Swing% O-Contact% Z-Swing% Z-Contact% Swing% Contact% K% BB% Mar/Apr 40.9% 72.4% 69.7% 90.4% 54.7% 83.4% 19.9% 5.9% May 35.4% 79.8% 66.8% 94.3% 50.2% 88.9% 12.3% 9.0% June 44.8% 56.6% 68.6% 90.7% 55.7% 75.9% 23.9% 2.6% In May, Bichette found the sweet spot. He chased less and made more contact when he did. His strikeout rate dropped to 12.3%, while his walk rate climbed to 9.0%. It was the version of Bichette that had made him so productive in previous seasons: aggressive, but controlled. Then, June arrived. His O-Swing% jumped 9.4 percentage points. His O-Contact% collapsed by more than 23 points. He went from missing two out of every ten swings at pitches outside the zone to missing more than four. His strikeout rate nearly doubled, while his walk rate fell to less than one-third of its May level. Yet his production improved. His ISO rose from .090 to .220. His slugging percentage jumped from .297 to .541. He hit five home runs in June after hitting only three in May. Month Blast Contact% Squared-Up Contact% Barrel/BBE% Attack Angle Ideal Attack Angle% HardHit% EV May 14.1% 31.6% 11.5% 2° 24.0% 42.7% 90.4 June 17.0% 35.2% 6.0% 4° 31.1% 43.4% 91.2 Blast Contact and Squared-Up Contact describe how well the ball was struck when contact occurred. Barrel/BBE measures how often batted balls reached the specific combination of exit velocity and launch angle that Statcast classifies as barrels. In June, Bichette improved both his Blast Contact and Squared-Up Contact rates. When he made contact, he hit the ball harder and found the sweet spot more often. The problem was that he made contact far less often. His Whiff% jumped from 11.6% to 26.8%. While some indicators of contact quality improved, that improvement did not translate into a higher barrel rate. His Barrel/BBE fell from 11.5% to 6.0%, suggesting that the gains in contact quality were neither uniform nor complete across the various dimensions measured by Statcast. There was also a change in his batted-ball profile. His average Attack Angle increased from 2 degrees to 4 degrees, while his Ideal Attack Angle% climbed from 24.0% to 31.1%. He elevated the ball, helping explain the power surge. That adjustment was real, but it came with a broader deterioration in the rest of his offensive profile. His ability to put the ball in play declined. His strikeouts increased. His walks disappeared. The improvements in certain contact-quality metrics arrived alongside a decline in the underlying process. His .380 BABIP, well above his career mark of .334, points to good fortune. His .299 expected batting average versus an actual .321 average indicates that the quality of contact justified much of the production, but not all. Which brings us back to the original question. What June demonstrated is that Bichette has a larger margin for error than most hitters. His bat-to-ball ability gives him that margin. Few hitters could survive that process for a month and still produce. But surviving is not the same thing as sustaining. For one month, Bichette drifted toward a three-outcome profile: more strikeouts, few walks, and damage whenever he managed to make contact. That is not the profile on which he built his career, nor the profile that best leverages his greatest strength. The evidence points to one conclusion: an aggressive approach can work for Bichette, but only as long as aggression doesn't become an unchecked chasing habit.
 -
Image courtesy of © Dan Hamilton-Imagn Images Francisco Lindor finally returned to the New York Mets' lineup last Wednesday. The biggest question, though, isn't whether he'll find his rhythm again after the injury. That question existed before he went on the injured list. The real one, at least for us sickos who still have a glimmer of hope with this team, is this: Can he punish four-seam fastballs the way he did in 2024? When Lindor went down, he was still a productive hitter. He was getting on base, controlling the strike zone and providing offensive value. What had changed was how he created that production. The quality of contact that drove the best offensive season of his career had already started to slip. In 2024, Lindor hit the ball with a level of authority he had never before sustained over a full season. His 13.6% barrel rate was the highest of his career, while his .539 expected slugging percentage (xSLG) reflected a hitter who turned quality contact into extra-base damage. That offensive profile looks very different today. Season Barrel % xSLG 2024 13.6% .539 2025 8.9% .454 2026 8.1% .427 The drop in barrels doesn't make Lindor a bad hitter. More importantly, it doesn't point to an obvious physical decline. His average exit velocity remains among the best of his career. His hard-hit rate is still above the major-league average. Before the injury, he was walking more often than he did in 2025 while keeping his strikeout rate below the MLB average. If the bat speed is still there and the plate discipline hasn't disappeared, the answer has to be somewhere else. Everything points to the pitch he sees more than any other. Four-seam fastballs account for nearly 40% of every pitch Lindor faces. No other pitch has a greater impact on his offensive production. That's where the biggest change appears. Pitch Type BA 2024-25 BA 2026 SLG 2024-25 SLG 2026 Four-Seam Fastball .263 .209 .527 .465 The sample remains small—just 122 plate appearances before the injury—but the decline is already apparent. The interesting part is that Lindor doesn't appear to be losing the battle against velocity. His whiff rate against four-seamers has barely changed. In other words, the problem isn't catching up to the pitch, but rather what happens after he does. The next clue comes from his production across the strike zone. Lindor's wOBA in 2025 Lindor's wOBA in 2026 The problem is concentrated in one area. Pitches at the top of the strike zone have become the spot where opposing pitchers are doing the best job of limiting Lindor's quality of contact. Roughly 28% of the pitches he sees in the strike zone are located there, and he is no longer driving them with the same authority he showed just two seasons ago. That trend was already in place before the injury, and it explains far more about Lindor's season than any tiny sample since his return. The injury was never the turning point in this story. It only put it on pause. Now that Lindor is back, the question remains the same as it was before his absence: Can he regain the command of the four-seam fastball that defined the best offensive season of his career? View full article
-
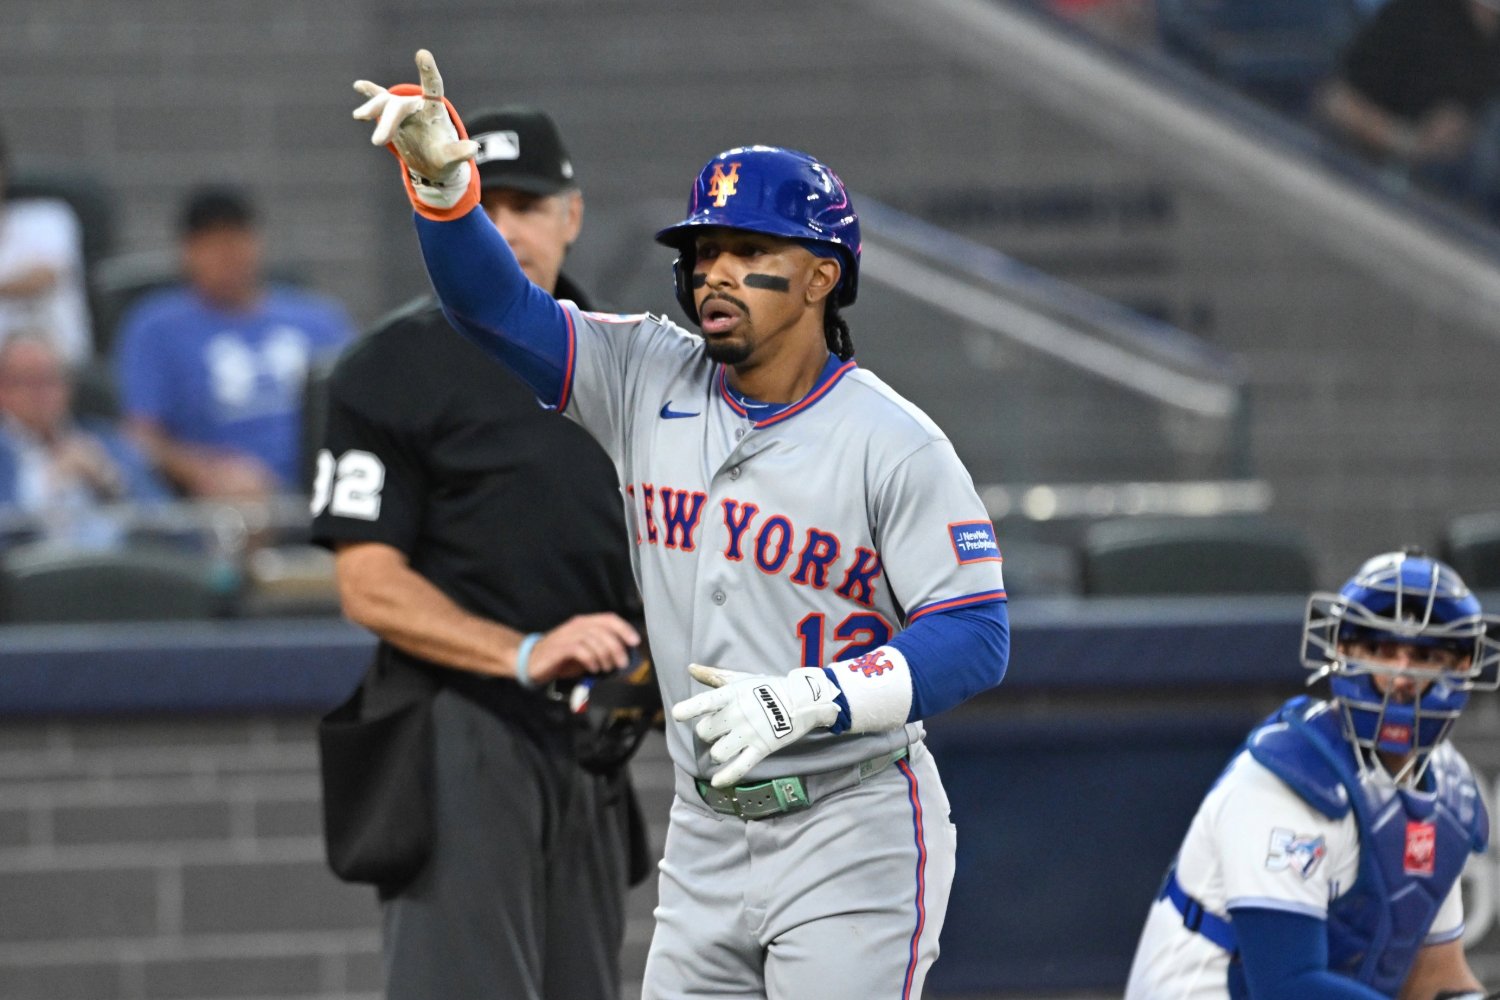 Francisco Lindor finally returned to the New York Mets' lineup last Wednesday. The biggest question, though, isn't whether he'll find his rhythm again after the injury. That question existed before he went on the injured list. The real one, at least for us sickos who still have a glimmer of hope with this team, is this: Can he punish four-seam fastballs the way he did in 2024? When Lindor went down, he was still a productive hitter. He was getting on base, controlling the strike zone and providing offensive value. What had changed was how he created that production. The quality of contact that drove the best offensive season of his career had already started to slip. In 2024, Lindor hit the ball with a level of authority he had never before sustained over a full season. His 13.6% barrel rate was the highest of his career, while his .539 expected slugging percentage (xSLG) reflected a hitter who turned quality contact into extra-base damage. That offensive profile looks very different today. Season Barrel % xSLG 2024 13.6% .539 2025 8.9% .454 2026 8.1% .427 The drop in barrels doesn't make Lindor a bad hitter. More importantly, it doesn't point to an obvious physical decline. His average exit velocity remains among the best of his career. His hard-hit rate is still above the major-league average. Before the injury, he was walking more often than he did in 2025 while keeping his strikeout rate below the MLB average. If the bat speed is still there and the plate discipline hasn't disappeared, the answer has to be somewhere else. Everything points to the pitch he sees more than any other. Four-seam fastballs account for nearly 40% of every pitch Lindor faces. No other pitch has a greater impact on his offensive production. That's where the biggest change appears. Pitch Type BA 2024-25 BA 2026 SLG 2024-25 SLG 2026 Four-Seam Fastball .263 .209 .527 .465 The sample remains small—just 122 plate appearances before the injury—but the decline is already apparent. The interesting part is that Lindor doesn't appear to be losing the battle against velocity. His whiff rate against four-seamers has barely changed. In other words, the problem isn't catching up to the pitch, but rather what happens after he does. The next clue comes from his production across the strike zone. Lindor's wOBA in 2025 Lindor's wOBA in 2026 The problem is concentrated in one area. Pitches at the top of the strike zone have become the spot where opposing pitchers are doing the best job of limiting Lindor's quality of contact. Roughly 28% of the pitches he sees in the strike zone are located there, and he is no longer driving them with the same authority he showed just two seasons ago. That trend was already in place before the injury, and it explains far more about Lindor's season than any tiny sample since his return. The injury was never the turning point in this story. It only put it on pause. Now that Lindor is back, the question remains the same as it was before his absence: Can he regain the command of the four-seam fastball that defined the best offensive season of his career?
 -
Image courtesy of © Kyle Ross-Imagn Images Juan Soto can impact a game in countless ways. He can drive a fastball into the opposite-field seats; he can turn a pitcher’s mistake into extra bases; he can change the scoreboard with a single swing. But the skill that made him a star long before he reached his physical peak has always been something simpler and, in many ways, more valuable: He refuses to give away outs. Few hitters of his generation understand the strike zone the way Soto does. His patience and pitch recognition are elite. Since arriving in the major leagues as a teenager, he has consistently known which pitches deserve his swing and which pitches deserve his restraint. That ability is what made him one of baseball’s most coveted players. The New York Mets were not simply investing in a single player when they handed him the largest contract in professional sports history; they were investing in an offensive philosophy built around reaching base. Which is why the reality of the first half of 2026 feels so surprising. Sure, Soto has done his job. His .395 on-base percentage is lower than usual but still a gargantuan figure in the modern game. The problem is that the lineup around him has not consistently followed suit. The most revealing number of the season may also be the simplest one; now nearly halfway through the 2027 season, the Mets have posted a collective .297 on-base percentage. That's historically poor. Since the beginning of the Divisional Era in 1969, only one Mets team reached base less frequently through its first 77 games. Season OBP Through 77 Games Record 2013 .296 33-44 2026 .297 34-43 1993 .300 23-54 1983 .300 29-48 2015 .300 40-37 The company, as any Mets fan will tell you, is striking. The 2013 Mets, for instance, were a rebuilding club with limited offensive talent and little expectation of contention. They eventually finished 74-88. The 2026 Mets are not the same. They were built around Juan freaking Soto. Yet both teams produced virtually identical on-base numbers through this point of the season. That raises an uncomfortable question: How can a team featuring one of the greatest on-base hitters of the modern era generate so little offensive traffic? While the Mets drifted toward the bottom of the league in team OBP, Soto continued to look exactly like Juan Soto. He finished March and April with a .441 OBP. He followed with a .369 mark in May. In June, he climbed back over .400. There are no signs that his strike-zone command has diminished, nor any evidence that the discipline which made him one of baseball’s most reliable offensive forces has suddenly disappeared. The challenge for New York is that the offense has become overly dependent on that skill. June provides perhaps the clearest illustration of this paradox: Player June OBP Juan Soto .403 A.J. Ewing .353 Bo Bichette .346 Francisco Alvarez .316 Carson Benge .316 Marcus Semien .260 Jared Young .254 Brett Baty .246 Mark Vientos .226 Soto continues to set the standard, as expected. A.J. Ewing has supplied quality plate appearances. Bo Bichette has finally begun to resemble the hitter the Mets expected when they acquired him. Even Carson Benge continues to show encouraging signs as he establishes himself at the major-league level. After that, though, the drop-off becomes difficult to ignore. Marcus Semien, brought in to provide stability and veteran consistency, owns a .260 OBP in June. Mark Vientos has fallen to a .226 mark. Brett Baty followed a strong .365 mark in May with a .246 OBP this month. The result is an offense that struggles to sustain pressure. Too many plate appearances are ending without a baserunner, and too many rallies die before they have a chance to develop. Too often, the lineup is asking its power hitters to create offense from empty bases. And thus we arrive at the ultimate failure of the 2026 Mets. This isn't a story about Juan Soto, but rather a story about offensive construction. Bichette spent much of April and May struggling to reach base before breaking through in June. Baty looked like a key contributor one month and took a significant step backward the next. Jared Young started well before losing momentum. Meanwhile, Ewing and Benge have emerged as legitimate contributors, but both are still learning how to navigate the daily demands of becoming core pieces on a contender. The inconsistency has pushed the offense toward a more fragile formula than the front office likely envisioned. For much of June, they have remained close to league average offensively because the power has shown up. Home runs and extra-base hits have helped compensate for the lack of baserunners. Unfortunately, as we've seen all too often this year, power and hot streaks are unreliable. Getting on base is a skill that tends last no matter what. Which is part of what makes the comparison to 2013 so fascinating. That roster lacked the offensive ceiling of the current club, but the responsibility for creating traffic was spread throughout the lineup. David Wright posted a .390 OBP during that stretch. Lucas Duda finished at .362. Daniel Murphy contributed a .315 mark. No single hitter carried the entire burden. In 2026, much of that responsibility has fallen on one player. Soto is not merely the best on-base hitter in the lineup. He is, by a considerable margin, the most dependable one. That distinction helps explain how a team can employ perhaps the most disciplined offensive player of his generation and still produce one of the lowest on-base percentages in modern franchise history. There are legitimate reasons to believe improvement is possible; a roster doesn't become this expensive without have a lot of talent to show for it, after all. But improvement will not come from asking more of Soto, because he is already providing exactly what the Mets paid for. The real question facing New York over the season’s second half is whether the hitters around him can transform his greatest strength into a shared identity. View full article
-
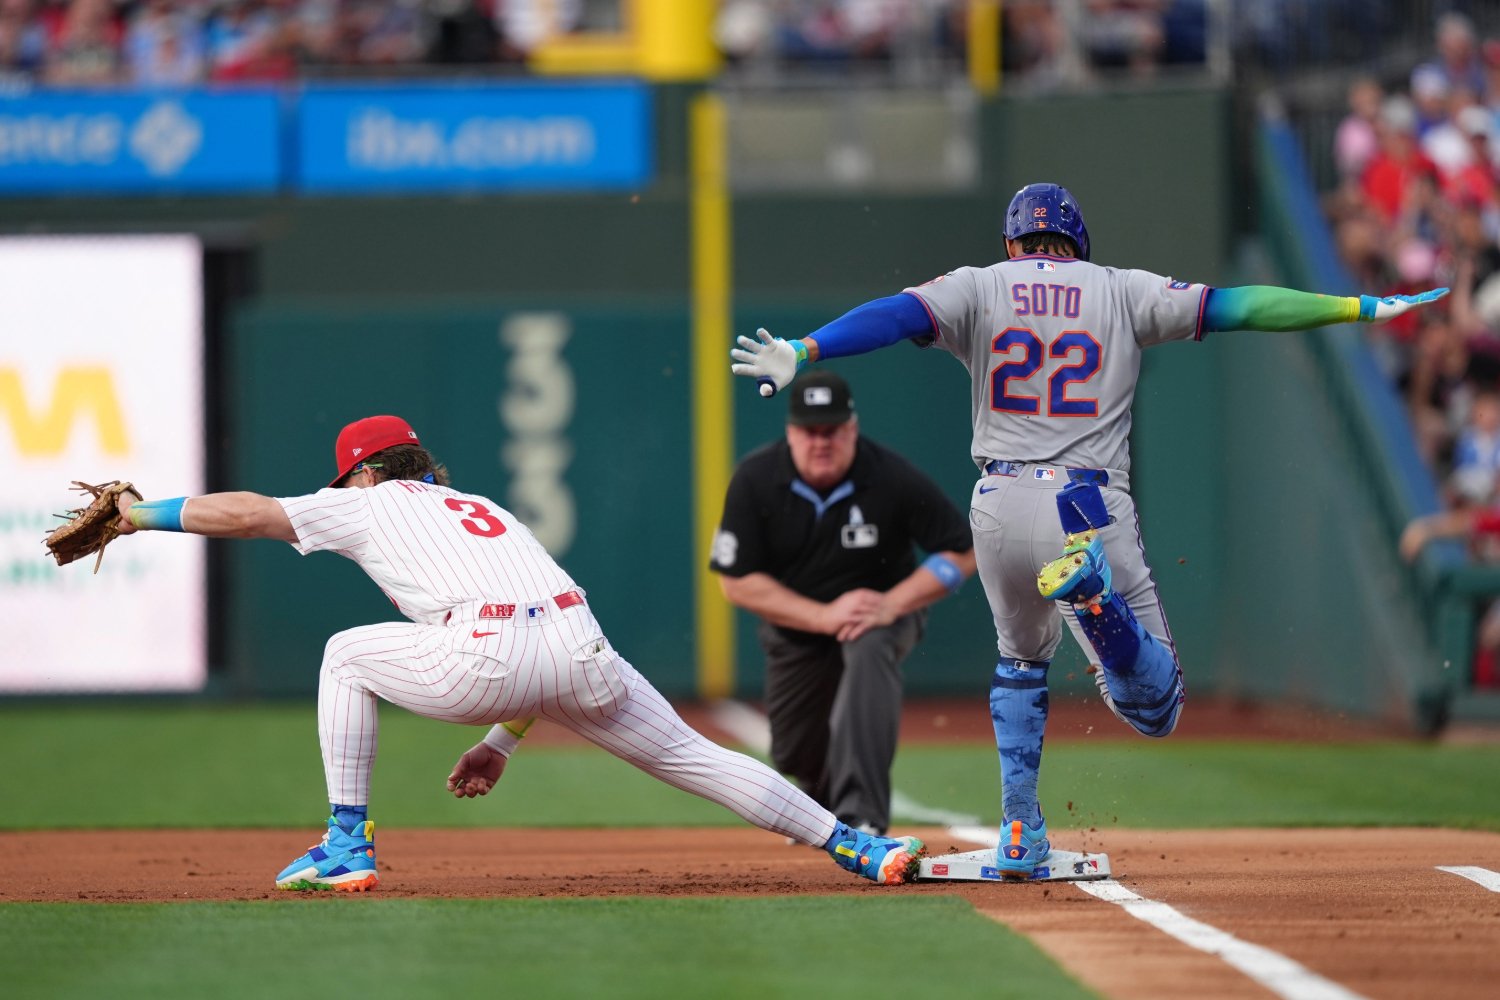 Juan Soto can impact a game in countless ways. He can drive a fastball into the opposite-field seats; he can turn a pitcher’s mistake into extra bases; he can change the scoreboard with a single swing. But the skill that made him a star long before he reached his physical peak has always been something simpler and, in many ways, more valuable: He refuses to give away outs. Few hitters of his generation understand the strike zone the way Soto does. His patience and pitch recognition are elite. Since arriving in the major leagues as a teenager, he has consistently known which pitches deserve his swing and which pitches deserve his restraint. That ability is what made him one of baseball’s most coveted players. The New York Mets were not simply investing in a single player when they handed him the largest contract in professional sports history; they were investing in an offensive philosophy built around reaching base. Which is why the reality of the first half of 2026 feels so surprising. Sure, Soto has done his job. His .395 on-base percentage is lower than usual but still a gargantuan figure in the modern game. The problem is that the lineup around him has not consistently followed suit. The most revealing number of the season may also be the simplest one; now nearly halfway through the 2027 season, the Mets have posted a collective .297 on-base percentage. That's historically poor. Since the beginning of the Divisional Era in 1969, only one Mets team reached base less frequently through its first 77 games. Season OBP Through 77 Games Record 2013 .296 33-44 2026 .297 34-43 1993 .300 23-54 1983 .300 29-48 2015 .300 40-37 The company, as any Mets fan will tell you, is striking. The 2013 Mets, for instance, were a rebuilding club with limited offensive talent and little expectation of contention. They eventually finished 74-88. The 2026 Mets are not the same. They were built around Juan freaking Soto. Yet both teams produced virtually identical on-base numbers through this point of the season. That raises an uncomfortable question: How can a team featuring one of the greatest on-base hitters of the modern era generate so little offensive traffic? While the Mets drifted toward the bottom of the league in team OBP, Soto continued to look exactly like Juan Soto. He finished March and April with a .441 OBP. He followed with a .369 mark in May. In June, he climbed back over .400. There are no signs that his strike-zone command has diminished, nor any evidence that the discipline which made him one of baseball’s most reliable offensive forces has suddenly disappeared. The challenge for New York is that the offense has become overly dependent on that skill. June provides perhaps the clearest illustration of this paradox: Player June OBP Juan Soto .403 A.J. Ewing .353 Bo Bichette .346 Francisco Alvarez .316 Carson Benge .316 Marcus Semien .260 Jared Young .254 Brett Baty .246 Mark Vientos .226 Soto continues to set the standard, as expected. A.J. Ewing has supplied quality plate appearances. Bo Bichette has finally begun to resemble the hitter the Mets expected when they acquired him. Even Carson Benge continues to show encouraging signs as he establishes himself at the major-league level. After that, though, the drop-off becomes difficult to ignore. Marcus Semien, brought in to provide stability and veteran consistency, owns a .260 OBP in June. Mark Vientos has fallen to a .226 mark. Brett Baty followed a strong .365 mark in May with a .246 OBP this month. The result is an offense that struggles to sustain pressure. Too many plate appearances are ending without a baserunner, and too many rallies die before they have a chance to develop. Too often, the lineup is asking its power hitters to create offense from empty bases. And thus we arrive at the ultimate failure of the 2026 Mets. This isn't a story about Juan Soto, but rather a story about offensive construction. Bichette spent much of April and May struggling to reach base before breaking through in June. Baty looked like a key contributor one month and took a significant step backward the next. Jared Young started well before losing momentum. Meanwhile, Ewing and Benge have emerged as legitimate contributors, but both are still learning how to navigate the daily demands of becoming core pieces on a contender. The inconsistency has pushed the offense toward a more fragile formula than the front office likely envisioned. For much of June, they have remained close to league average offensively because the power has shown up. Home runs and extra-base hits have helped compensate for the lack of baserunners. Unfortunately, as we've seen all too often this year, power and hot streaks are unreliable. Getting on base is a skill that tends last no matter what. Which is part of what makes the comparison to 2013 so fascinating. That roster lacked the offensive ceiling of the current club, but the responsibility for creating traffic was spread throughout the lineup. David Wright posted a .390 OBP during that stretch. Lucas Duda finished at .362. Daniel Murphy contributed a .315 mark. No single hitter carried the entire burden. In 2026, much of that responsibility has fallen on one player. Soto is not merely the best on-base hitter in the lineup. He is, by a considerable margin, the most dependable one. That distinction helps explain how a team can employ perhaps the most disciplined offensive player of his generation and still produce one of the lowest on-base percentages in modern franchise history. There are legitimate reasons to believe improvement is possible; a roster doesn't become this expensive without have a lot of talent to show for it, after all. But improvement will not come from asking more of Soto, because he is already providing exactly what the Mets paid for. The real question facing New York over the season’s second half is whether the hitters around him can transform his greatest strength into a shared identity.
 -
Image courtesy of © Brad Mills-Imagn Images It’s easy to explain the New York Mets’ season by focusing on everything that has gone wrong. The inconsistencies have been impossible to ignore. Several veterans have failed to meet expectations, and at various points the lineup has looked nothing like the version the organization envisioned when it committed to building around Juan Soto. None of that is inaccurate, but disappointing seasons can also provide valuable answers. When wins become harder to find, organizations get an opportunity to identify which young players might be ready to contribute to the next competitive roster. That could prove to be one of the most important developments of this season. Soto remains the franchise’s cornerstone. Over the last 30 days, he has produced an elite 187 wRC+, once again reminding everyone why he remains one of the most complete hitters in baseball. The Mets do not need another superstar bat. What they need is a group capable of growing alongside him. And, for the first time in quite a while, it looks like they may be starting to find one. Carson Benge and the Value of Adjusting Quickly Prospect development is rarely linear. Even the most talented young players typically go through an adjustment period when professional pitching exposes just how difficult hitting can be at the highest level. Opposing pitchers identify weaknesses, alter their approach, and force hitters to respond. That’s what makes Carson Benge’s progression so encouraging. His first few weeks were difficult. Between March and April, he managed just a 50 wRC+ and often looked like a hitter searching for answers. Since then, however, the story has changed. Benge does not look like a player benefiting from an unsustainable hot streak. His plate discipline remains solid for a young hitter, he continues to make contact at an 80%+ rate, and he has started driving the ball with more authority without abandoning the offensive approach that brought him this far. Many young hitters respond to early struggles by chasing power. Benge has taken a different route. He has focused on building a more complete offensive profile while learning to navigate the constant adjustments that come with facing advanced pitching. That process is often one of the clearest indicators of long-term growth. A.J. Ewing Is Finding Ways to Impact the Game Ewing represents a different type of prospect. There is no single standout tool that immediately jumps off the page. Instead, his value comes from the number of ways he can contribute. He controls the strike zone better than expected for a player with limited experience, adds value with his speed, and has already shown the ability to contribute defensively. Even with a strikeout rate that still needs refinement, he has managed to remain close to league-average offensive production. Players like that rarely generate headlines. Winning teams need stars, but they also need players capable of helping in multiple areas when the bat is not carrying the load. Ewing still has work to dom but he is already showing several paths toward becoming an every-day major leaguer. Francisco Álvarez Remains the Most Important Piece of the Puzzle If there is one player in this group with legitimate star-level upside, it is probably still Francisco Álvarez. His offensive production this season has been solid rather than spectacular. His adjusted numbers tell a straightforward story: a 105 AVG+, 102 OBP+, and 105 wRC+ (where 100 is league average). Nothing extraordinary, but also clearly the profile of an above-average hitter. It's the tools that remain the biggest reason for optimism. Álvarez continues to post a 74.5 mph bat speed—one of the best marks on the roster—while his 46.4% fast-swing rate reflects a rare ability to generate both bat speed and impact through the zone. Those traits are, obviously, difficult to teach. Álvarez’s still look like those of a catcher capable of becoming an offensive difference-maker for years to come. A Mets Foundation That Is Starting to Take Shape The best news for the Mets is not that Benge, Ewing, and Álvarez have arrived as finished product. Rather, they're all giving fans a different reason to believe in their long-term futures. Benge has shown an ability to adjust. Ewing is finding ways to impact games while continuing to refine his skill set. Álvarez still possesses the traits that once made him one of the most highly regarded prospects in baseball. None of that guarantees future success. Player development never works that way. But after a season filled with frustration, the Mets can now say something that seemed far less certain just a few months ago: The team that will eventually be asked to support Juan Soto is more than just an on-paper dream. View full article
-
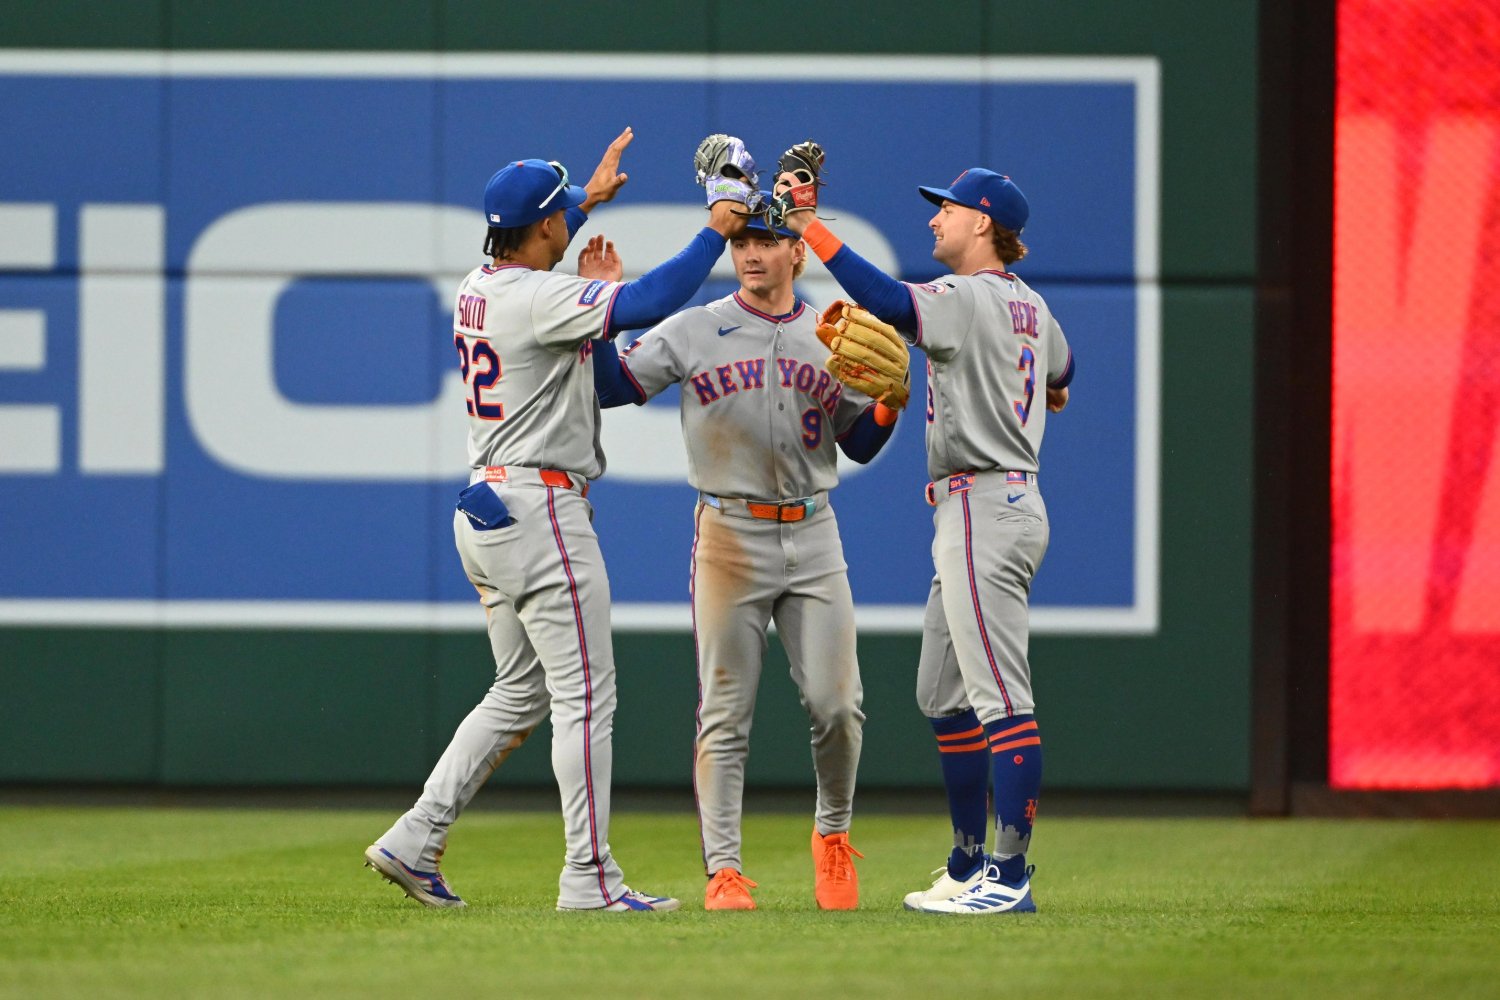 It’s easy to explain the New York Mets’ season by focusing on everything that has gone wrong. The inconsistencies have been impossible to ignore. Several veterans have failed to meet expectations, and at various points the lineup has looked nothing like the version the organization envisioned when it committed to building around Juan Soto. None of that is inaccurate, but disappointing seasons can also provide valuable answers. When wins become harder to find, organizations get an opportunity to identify which young players might be ready to contribute to the next competitive roster. That could prove to be one of the most important developments of this season. Soto remains the franchise’s cornerstone. Over the last 30 days, he has produced an elite 187 wRC+, once again reminding everyone why he remains one of the most complete hitters in baseball. The Mets do not need another superstar bat. What they need is a group capable of growing alongside him. And, for the first time in quite a while, it looks like they may be starting to find one. Carson Benge and the Value of Adjusting Quickly Prospect development is rarely linear. Even the most talented young players typically go through an adjustment period when professional pitching exposes just how difficult hitting can be at the highest level. Opposing pitchers identify weaknesses, alter their approach, and force hitters to respond. That’s what makes Carson Benge’s progression so encouraging. His first few weeks were difficult. Between March and April, he managed just a 50 wRC+ and often looked like a hitter searching for answers. Since then, however, the story has changed. Benge does not look like a player benefiting from an unsustainable hot streak. His plate discipline remains solid for a young hitter, he continues to make contact at an 80%+ rate, and he has started driving the ball with more authority without abandoning the offensive approach that brought him this far. Many young hitters respond to early struggles by chasing power. Benge has taken a different route. He has focused on building a more complete offensive profile while learning to navigate the constant adjustments that come with facing advanced pitching. That process is often one of the clearest indicators of long-term growth. A.J. Ewing Is Finding Ways to Impact the Game Ewing represents a different type of prospect. There is no single standout tool that immediately jumps off the page. Instead, his value comes from the number of ways he can contribute. He controls the strike zone better than expected for a player with limited experience, adds value with his speed, and has already shown the ability to contribute defensively. Even with a strikeout rate that still needs refinement, he has managed to remain close to league-average offensive production. Players like that rarely generate headlines. Winning teams need stars, but they also need players capable of helping in multiple areas when the bat is not carrying the load. Ewing still has work to dom but he is already showing several paths toward becoming an every-day major leaguer. Francisco Álvarez Remains the Most Important Piece of the Puzzle If there is one player in this group with legitimate star-level upside, it is probably still Francisco Álvarez. His offensive production this season has been solid rather than spectacular. His adjusted numbers tell a straightforward story: a 105 AVG+, 102 OBP+, and 105 wRC+ (where 100 is league average). Nothing extraordinary, but also clearly the profile of an above-average hitter. It's the tools that remain the biggest reason for optimism. Álvarez continues to post a 74.5 mph bat speed—one of the best marks on the roster—while his 46.4% fast-swing rate reflects a rare ability to generate both bat speed and impact through the zone. Those traits are, obviously, difficult to teach. Álvarez’s still look like those of a catcher capable of becoming an offensive difference-maker for years to come. A Mets Foundation That Is Starting to Take Shape The best news for the Mets is not that Benge, Ewing, and Álvarez have arrived as finished product. Rather, they're all giving fans a different reason to believe in their long-term futures. Benge has shown an ability to adjust. Ewing is finding ways to impact games while continuing to refine his skill set. Álvarez still possesses the traits that once made him one of the most highly regarded prospects in baseball. None of that guarantees future success. Player development never works that way. But after a season filled with frustration, the Mets can now say something that seemed far less certain just a few months ago: The team that will eventually be asked to support Juan Soto is more than just an on-paper dream.
-
- 1
-

-
- aj ewing
- carson benge
- (and 2 more)
-
Image courtesy of © Brad Penner-Imagn Images When Jared Young returned to the New York Mets' lineup on May 26 after missing more than six weeks with a torn left meniscus, attention quickly shifted toward the most visible results. After all, home runs are usually the fastest way to attract attention in Major League Baseball. Young was placed on the injured list on April 13 and required a six-game rehabilitation assignment between St. Lucie and Syracuse before being cleared to return. Since coming back, he has hit four home runs and posted a .750 OPS over his first 18 games, providing a meaningful contribution to a Mets offense that has searched for production throughout the lineup. However, the home runs do not appear to be the most interesting part of the story. A deeper look suggests that Young's offensive development has far less to do with a power surge and much more to do with the way he is building each plate appearance. That evolution begins with swing decisions. Plate Discipline 2025 2026 Chase Rate 28.7% 26.3% Zone Swing Rate 67.3% 73.1% In-Zone Contact Rate 81.8% 87.2% Strikeout Rate 34.0% 21.6% The decline in his chase rate may seem modest in isolation, but it becomes more meaningful when viewed alongside the rest of his profile. Young is chasing fewer pitches outside the strike zone while increasing the frequency with which he swings at strikes. In other words, he is becoming more selective without becoming passive. Naturally, the most significant change in Young's profile is his strikeout rate. After striking out in 34.0% of his plate appearances last season, that figure has fallen to 21.6% in 2026. His improvement on pitches in the strike zone is especially noteworthy. Young's In-Zone Contact Rate has increased from 81.8% to 87.2%, a substantial jump in an environment where plate appearances are often decided by the smallest margins. Every avoided swing-and-miss creates another opportunity to put the ball in play and force the defense to make a play. Of course, making more contact only matters if the quality of that contact remains intact. That is where Young's profile becomes particularly interesting. Quality of Contact 2025 2026 Hard-Hit Rate 39.3% 45.9% Avg. Exit Velocity 84.6 mph 89.9 mph xwOBA .296 .344 Squared-Up Contact% 23.60% 27.20% The numbers show that Young is not sacrificing impact in exchange for contact. His hard-hit rate has increased by more than six percentage points compared to last season, while his average exit velocity has jumped by more than five miles per hour. At the same time, his xwOBA has improved from .296 to .344, suggesting that the quality of his contact has improved along with his ability to put the ball in play. The increase in squared-up contact rate reinforces that conclusion. Young is producing efficient contact more frequently than he did a year ago, another indicator that the gains in his profile extend beyond simple results. The data also suggest that these gains are being driven by efficiency rather than increased effort. Young's average bat speed has actually declined slightly from last season, making it unlikely that the improved results stem from a more aggressive approach. Instead, the evidence points toward a hitter who is finding better pitches to attack and maximizing more of the opportunities he gets. That distinction matters because improvements in plate discipline and contact quality often provide a stronger foundation than short-term fluctuations in power production. Home run totals can rise and fall over the course of a season, but underlying skills tend to offer a clearer picture of whether a hitter is genuinely improving. There are still limitations in Young's profile. His production against left-handed pitching remains well below what he has done against right-handers, a split that opposing clubs will continue trying to exploit. Through 2026, he owns a 130 wRC+ against right-handed pitching compared to an 8 wRC+ against left-handers, illustrating how much of his offensive value remains tied to favorable matchups. Even so, the broader trend is difficult to ignore. Fewer chases, more contact in the strike zone, and stronger underlying contact metrics all point in the same direction. Whether that translates into a larger offensive leap remains to be seen, but the indicators suggest Young is becoming a more complete hitter than the one the Mets saw a year ago. View full article
-
Jared Young Is Proving Better Plate Discipline Begets Better Contact
Yirsandy Rodríguez posted an article in Mets
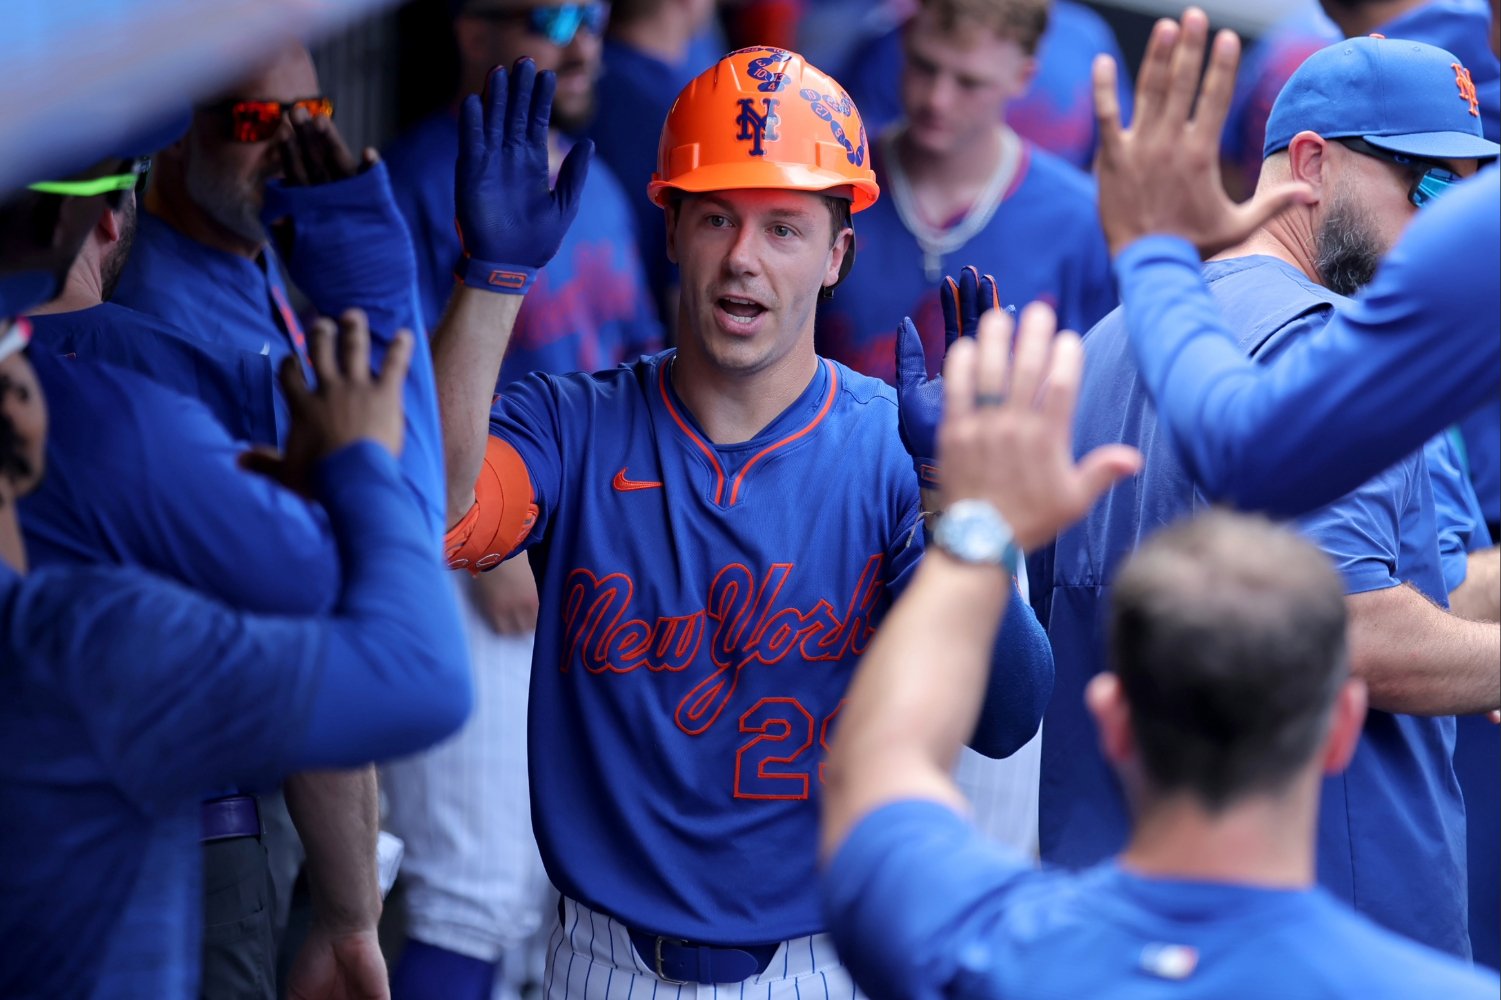 When Jared Young returned to the New York Mets' lineup on May 26 after missing more than six weeks with a torn left meniscus, attention quickly shifted toward the most visible results. After all, home runs are usually the fastest way to attract attention in Major League Baseball. Young was placed on the injured list on April 13 and required a six-game rehabilitation assignment between St. Lucie and Syracuse before being cleared to return. Since coming back, he has hit four home runs and posted a .750 OPS over his first 18 games, providing a meaningful contribution to a Mets offense that has searched for production throughout the lineup. However, the home runs do not appear to be the most interesting part of the story. A deeper look suggests that Young's offensive development has far less to do with a power surge and much more to do with the way he is building each plate appearance. That evolution begins with swing decisions. Plate Discipline 2025 2026 Chase Rate 28.7% 26.3% Zone Swing Rate 67.3% 73.1% In-Zone Contact Rate 81.8% 87.2% Strikeout Rate 34.0% 21.6% The decline in his chase rate may seem modest in isolation, but it becomes more meaningful when viewed alongside the rest of his profile. Young is chasing fewer pitches outside the strike zone while increasing the frequency with which he swings at strikes. In other words, he is becoming more selective without becoming passive. Naturally, the most significant change in Young's profile is his strikeout rate. After striking out in 34.0% of his plate appearances last season, that figure has fallen to 21.6% in 2026. His improvement on pitches in the strike zone is especially noteworthy. Young's In-Zone Contact Rate has increased from 81.8% to 87.2%, a substantial jump in an environment where plate appearances are often decided by the smallest margins. Every avoided swing-and-miss creates another opportunity to put the ball in play and force the defense to make a play. Of course, making more contact only matters if the quality of that contact remains intact. That is where Young's profile becomes particularly interesting. Quality of Contact 2025 2026 Hard-Hit Rate 39.3% 45.9% Avg. Exit Velocity 84.6 mph 89.9 mph xwOBA .296 .344 Squared-Up Contact% 23.60% 27.20% The numbers show that Young is not sacrificing impact in exchange for contact. His hard-hit rate has increased by more than six percentage points compared to last season, while his average exit velocity has jumped by more than five miles per hour. At the same time, his xwOBA has improved from .296 to .344, suggesting that the quality of his contact has improved along with his ability to put the ball in play. The increase in squared-up contact rate reinforces that conclusion. Young is producing efficient contact more frequently than he did a year ago, another indicator that the gains in his profile extend beyond simple results. The data also suggest that these gains are being driven by efficiency rather than increased effort. Young's average bat speed has actually declined slightly from last season, making it unlikely that the improved results stem from a more aggressive approach. Instead, the evidence points toward a hitter who is finding better pitches to attack and maximizing more of the opportunities he gets. That distinction matters because improvements in plate discipline and contact quality often provide a stronger foundation than short-term fluctuations in power production. Home run totals can rise and fall over the course of a season, but underlying skills tend to offer a clearer picture of whether a hitter is genuinely improving. There are still limitations in Young's profile. His production against left-handed pitching remains well below what he has done against right-handers, a split that opposing clubs will continue trying to exploit. Through 2026, he owns a 130 wRC+ against right-handed pitching compared to an 8 wRC+ against left-handers, illustrating how much of his offensive value remains tied to favorable matchups. Even so, the broader trend is difficult to ignore. Fewer chases, more contact in the strike zone, and stronger underlying contact metrics all point in the same direction. Whether that translates into a larger offensive leap remains to be seen, but the indicators suggest Young is becoming a more complete hitter than the one the Mets saw a year ago.
 -
Brett Baty entered 2026 with far fewer questions surrounding his future than he had a year earlier. After finally translating his offensive tools into production during a breakout 2025 season, he appeared to have established himself as a meaningful part of the New York Mets' long-term plans. A few months later, much of that certainty has disappeared. The former first-round pick entered 2025 carrying many of the same questions that had followed him since his debut. The tools were obvious. The raw power was obvious. The talent that once made him one of the most highly regarded prospects in the Mets' system was obvious. What had never fully arrived was the production. From 2022 through 2024, Baty never posted a season above an 83 wRC+. He hit just .212 in 2023 and managed a .327 slugging percentage in 2024. Every slump seemed to reinforce the same concern: maybe the skills that made him such an intriguing prospect simply would not translate consistently against major-league pitching. Then came 2025. For the first time, Baty looked like a player capable of turning potential into production. He hit 18 home runs, posted a .435 slugging percentage, and finished the season with a 111 wRC+, comfortably above league average. More importantly, his .334 xwOBA actually exceeded his .324 wOBA, a sign that much of his success was supported by genuine improvements in his offensive profile. For a player whose future had often seemed tied to unanswered questions, that season felt different. It felt like a breakthrough. Which is why his 2026 season has been so perplexing. At first glance, it looks like a return to the player the Mets thought they had finally left behind. The easy conclusion is tempting. Baty finally broke through in 2025, then slipped right back into old habits. A deeper look at the numbers, however, points toward a much more specific explanation. The swing metrics paint a different picture than the results. His bat speed, his rate of fast swings, and the overall quality of his contact remain remarkably similar to what they were a year ago. Nor has there been a meaningful decline in his plate discipline that would fully explain such a sharp drop in offensive production. The problem begins after contact. His ISO has fallen from .181 to .092, while his home run-to-fly-ball rate has collapsed from 22.5% to just 6.0%. What's particularly striking is that Baty is actually hitting more fly balls than he did a year ago. His fly-ball rate has increased from 27.9% to 33.6%, while his ground-ball rate has declined significantly. So, where has the punch gone on his fly balls? The most interesting clue emerges when examining the types of pitches he faces. Before 2025, Baty's offensive success tended to come against a relatively narrow group of pitch types, particularly sinkers. What made last season different was his ability to expand that profile. For the first time, he consistently did damage against four-seam fastballs, forcing opposing pitchers to rethink how they could attack him. That improvement has clearly diminished in 2026. The difference against four-seamers is especially revealing. In 2025, Baty produced a 127 wRC+ against the pitch. This year, that figure has fallen to 92. It's not that he has stopped making contact against fastballs altogether. The issue is that he is no longer punishing them with the same authority. Even so, the numbers do not support the idea that the 2025 version of Baty has completely disappeared. His .360 xSLG comfortably exceeds his actual .318 slugging percentage, while his .296 xwOBA also sits above his .283 wOBA. Those aren't massive gaps, but they are large enough to suggest that the quality of his contact has been somewhat better than the final results indicate. And that brings us to the central question. In 2025, Baty found a way to punish four-seam fastballs with a consistency he had never shown before. That ability expanded his margin for error and allowed him to compensate for other weaknesses that remain part of his game. Can he get back to being that player? That's why the rest of the season will be so revealing. The future of his career, at least in New York with the Mets, may will be determined by how well he adjusts to his new deficiencies against the hard stuff. View full article
-
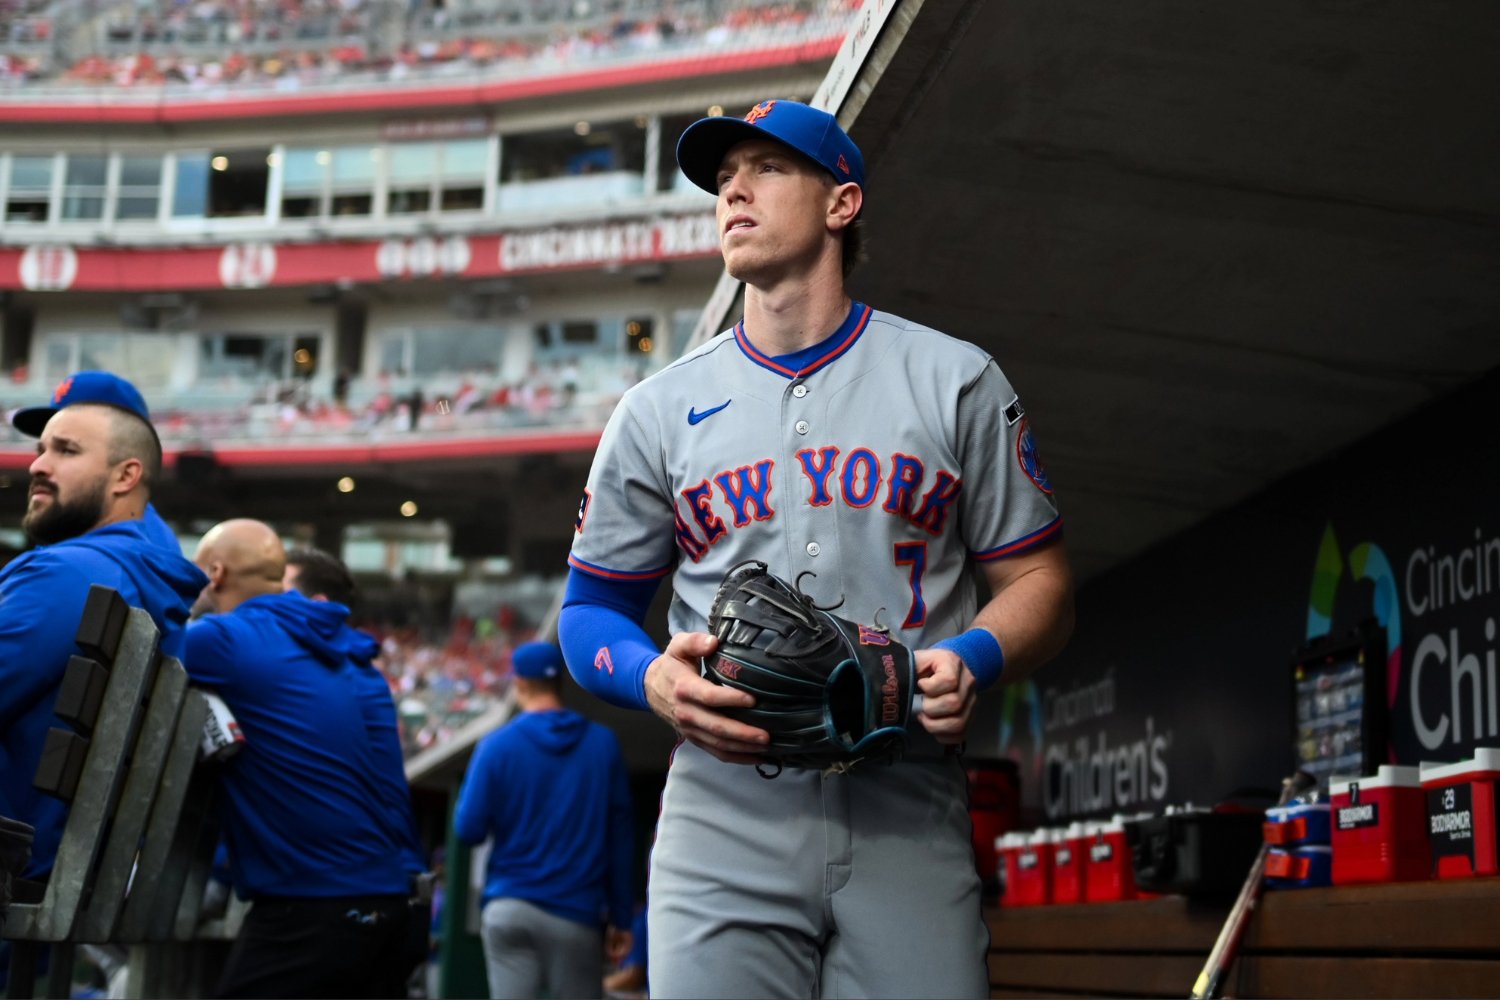 Brett Baty entered 2026 with far fewer questions surrounding his future than he had a year earlier. After finally translating his offensive tools into production during a breakout 2025 season, he appeared to have established himself as a meaningful part of the New York Mets' long-term plans. A few months later, much of that certainty has disappeared. The former first-round pick entered 2025 carrying many of the same questions that had followed him since his debut. The tools were obvious. The raw power was obvious. The talent that once made him one of the most highly regarded prospects in the Mets' system was obvious. What had never fully arrived was the production. From 2022 through 2024, Baty never posted a season above an 83 wRC+. He hit just .212 in 2023 and managed a .327 slugging percentage in 2024. Every slump seemed to reinforce the same concern: maybe the skills that made him such an intriguing prospect simply would not translate consistently against major-league pitching. Then came 2025. For the first time, Baty looked like a player capable of turning potential into production. He hit 18 home runs, posted a .435 slugging percentage, and finished the season with a 111 wRC+, comfortably above league average. More importantly, his .334 xwOBA actually exceeded his .324 wOBA, a sign that much of his success was supported by genuine improvements in his offensive profile. For a player whose future had often seemed tied to unanswered questions, that season felt different. It felt like a breakthrough. Which is why his 2026 season has been so perplexing. At first glance, it looks like a return to the player the Mets thought they had finally left behind. The easy conclusion is tempting. Baty finally broke through in 2025, then slipped right back into old habits. A deeper look at the numbers, however, points toward a much more specific explanation. The swing metrics paint a different picture than the results. His bat speed, his rate of fast swings, and the overall quality of his contact remain remarkably similar to what they were a year ago. Nor has there been a meaningful decline in his plate discipline that would fully explain such a sharp drop in offensive production. The problem begins after contact. His ISO has fallen from .181 to .092, while his home run-to-fly-ball rate has collapsed from 22.5% to just 6.0%. What's particularly striking is that Baty is actually hitting more fly balls than he did a year ago. His fly-ball rate has increased from 27.9% to 33.6%, while his ground-ball rate has declined significantly. So, where has the punch gone on his fly balls? The most interesting clue emerges when examining the types of pitches he faces. Before 2025, Baty's offensive success tended to come against a relatively narrow group of pitch types, particularly sinkers. What made last season different was his ability to expand that profile. For the first time, he consistently did damage against four-seam fastballs, forcing opposing pitchers to rethink how they could attack him. That improvement has clearly diminished in 2026. The difference against four-seamers is especially revealing. In 2025, Baty produced a 127 wRC+ against the pitch. This year, that figure has fallen to 92. It's not that he has stopped making contact against fastballs altogether. The issue is that he is no longer punishing them with the same authority. Even so, the numbers do not support the idea that the 2025 version of Baty has completely disappeared. His .360 xSLG comfortably exceeds his actual .318 slugging percentage, while his .296 xwOBA also sits above his .283 wOBA. Those aren't massive gaps, but they are large enough to suggest that the quality of his contact has been somewhat better than the final results indicate. And that brings us to the central question. In 2025, Baty found a way to punish four-seam fastballs with a consistency he had never shown before. That ability expanded his margin for error and allowed him to compensate for other weaknesses that remain part of his game. Can he get back to being that player? That's why the rest of the season will be so revealing. The future of his career, at least in New York with the Mets, may will be determined by how well he adjusts to his new deficiencies against the hard stuff.
 -
Image courtesy of © Wendell Cruz-Imagn Images There's something unusual on Freddy Peralta's FanGraphs page. His Stuff+ sits at just 95, a mark below league average and one of the lowest among the Mets' primary starters. For a pitcher whose reputation was built on the quality of his arsenal, that number immediately stands out. At first glance, it looks like the profile of a pitcher with an ordinary repertoire. The results, however, suggest something more complex—a contradiction that becomes easier to understand when examining Peralta's four-seam fastball. For years, that pitch served as the foundation of everything he did on the mound. It wasn't the hardest fastball in baseball, but it consistently played above its velocity, generating swings and misses and helping establish Peralta as one of the National League's toughest pitchers to square up. The numbers now point to a clear shift. Season Peralta's Four-Seam Stuff+ 2021 107 2022 103 2023 103 2024 100 2025 100 2026 96 The trend is difficult to ignore. A pitch that once graded comfortably above average now falls below that threshold. What's notable is that the rest of Peralta's arsenal has not experienced the same decline. His slider still carries a 102 Stuff+ grade. His curveball sits at 109, one of the strongest marks in his repertoire. Even his changeup remains largely in line with previous seasons. Rather than reflecting a broad deterioration across his pitch mix, the drop in Stuff+ is concentrated almost entirely in the fastball. Part of the explanation, as it is for any 30-year-old pitcher, is velocity. After averaging 94.8 mph on his four-seamer in 2025, Peralta is averaging 93.8 mph this season. A one-mile-per-hour drop may not sound dramatic, but for pitchers who depend heavily on fastball effectiveness, even modest losses can alter how a pitch plays against major league hitters. The swing-and-miss metrics tell a similar story. Peralta posted a 39.7% whiff rate in 2020. In 2026, that figure has fallen to 28.1%. His whiff rate ranking has also dropped, from the 83rd percentile to the 72nd percentile in just one season. Hitters are making more contact, and pitch-quality models are reflecting that reality. The more important question is what those changes mean. If the fastball explains much of the decline in Stuff+, why is Peralta still able to perform (on most night, at least) like a frontline starter? The answer becomes clearer when looking beyond raw pitch quality. Season Stuff+ Location+ Pitching+ 2023 102 107 108 2024 99 102 100 2025 99 108 106 2026 95 104 101 These numbers describe a pitcher whose success depends less on pure stuff than it once did and more on how effectively he deploys his arsenal. While his Stuff+ now sits below league average, his execution remains strong. That distinction helps explain why his overall performance has remained stable despite the decline in pitch quality. Many pitchers experience a gradual loss of stuff. The ones who remain effective are typically those who find other ways to compensate, and Peralta appears to fit that description. Despite the drop in Stuff+, his fastball continues to produce positive results. Opponents are hitting just .227 against the pitch and have generated only a .294 wOBA. It no longer earns elite grades from pitch-quality models, but it remains an effective weapon within his overall mix. Earlier versions of Peralta could overwhelm hitters with the raw quality of his pitches. The current version relies far more on execution, location, sequencing, and an ability to maximize every offering in his repertoire. As a result, the margin for error is smaller than it once was. The performance, however, has remained remarkably consistent, which is why a 95 Stuff+ requires additional context. Yes, hitters are making more contact. Swings and misses are less frequent. The models see a less dominant arsenal than they did a few years ago. Yet the overall results remain largely intact. That is the real story behind Peralta's evolution on the mound. It's the story of a pitcher preserving his value through execution, command, and a deeper understanding of how to leverage the stuff he still has. View full article
-
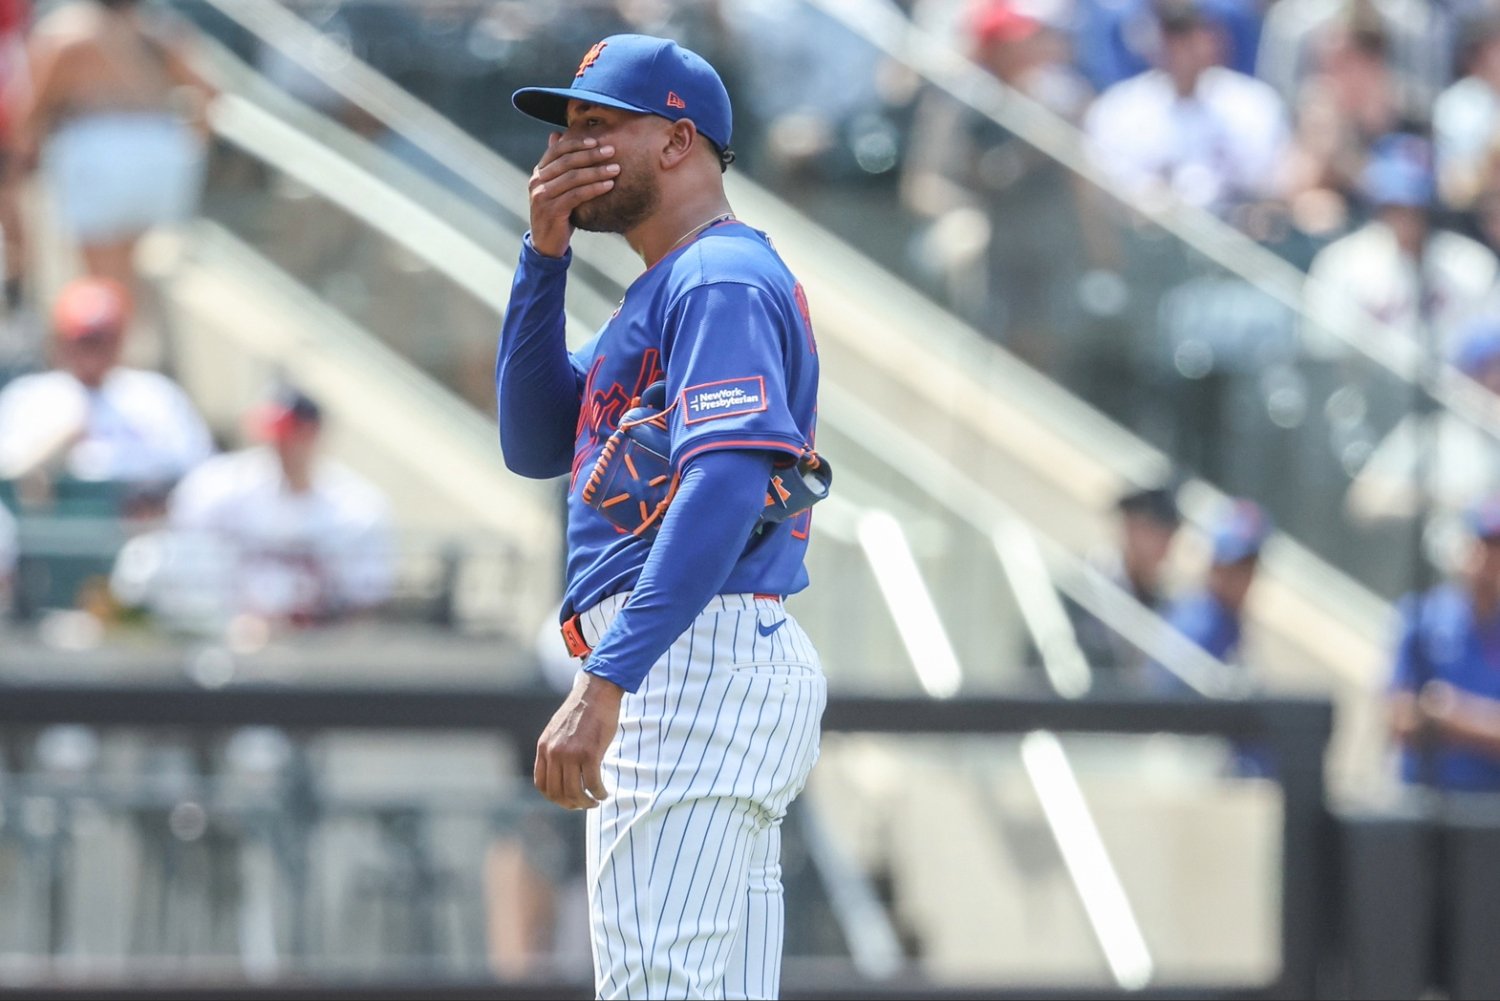 There's something unusual on Freddy Peralta's FanGraphs page. His Stuff+ sits at just 95, a mark below league average and one of the lowest among the Mets' primary starters. For a pitcher whose reputation was built on the quality of his arsenal, that number immediately stands out. At first glance, it looks like the profile of a pitcher with an ordinary repertoire. The results, however, suggest something more complex—a contradiction that becomes easier to understand when examining Peralta's four-seam fastball. For years, that pitch served as the foundation of everything he did on the mound. It wasn't the hardest fastball in baseball, but it consistently played above its velocity, generating swings and misses and helping establish Peralta as one of the National League's toughest pitchers to square up. The numbers now point to a clear shift. Season Peralta's Four-Seam Stuff+ 2021 107 2022 103 2023 103 2024 100 2025 100 2026 96 The trend is difficult to ignore. A pitch that once graded comfortably above average now falls below that threshold. What's notable is that the rest of Peralta's arsenal has not experienced the same decline. His slider still carries a 102 Stuff+ grade. His curveball sits at 109, one of the strongest marks in his repertoire. Even his changeup remains largely in line with previous seasons. Rather than reflecting a broad deterioration across his pitch mix, the drop in Stuff+ is concentrated almost entirely in the fastball. Part of the explanation, as it is for any 30-year-old pitcher, is velocity. After averaging 94.8 mph on his four-seamer in 2025, Peralta is averaging 93.8 mph this season. A one-mile-per-hour drop may not sound dramatic, but for pitchers who depend heavily on fastball effectiveness, even modest losses can alter how a pitch plays against major league hitters. The swing-and-miss metrics tell a similar story. Peralta posted a 39.7% whiff rate in 2020. In 2026, that figure has fallen to 28.1%. His whiff rate ranking has also dropped, from the 83rd percentile to the 72nd percentile in just one season. Hitters are making more contact, and pitch-quality models are reflecting that reality. The more important question is what those changes mean. If the fastball explains much of the decline in Stuff+, why is Peralta still able to perform (on most night, at least) like a frontline starter? The answer becomes clearer when looking beyond raw pitch quality. Season Stuff+ Location+ Pitching+ 2023 102 107 108 2024 99 102 100 2025 99 108 106 2026 95 104 101 These numbers describe a pitcher whose success depends less on pure stuff than it once did and more on how effectively he deploys his arsenal. While his Stuff+ now sits below league average, his execution remains strong. That distinction helps explain why his overall performance has remained stable despite the decline in pitch quality. Many pitchers experience a gradual loss of stuff. The ones who remain effective are typically those who find other ways to compensate, and Peralta appears to fit that description. Despite the drop in Stuff+, his fastball continues to produce positive results. Opponents are hitting just .227 against the pitch and have generated only a .294 wOBA. It no longer earns elite grades from pitch-quality models, but it remains an effective weapon within his overall mix. Earlier versions of Peralta could overwhelm hitters with the raw quality of his pitches. The current version relies far more on execution, location, sequencing, and an ability to maximize every offering in his repertoire. As a result, the margin for error is smaller than it once was. The performance, however, has remained remarkably consistent, which is why a 95 Stuff+ requires additional context. Yes, hitters are making more contact. Swings and misses are less frequent. The models see a less dominant arsenal than they did a few years ago. Yet the overall results remain largely intact. That is the real story behind Peralta's evolution on the mound. It's the story of a pitcher preserving his value through execution, command, and a deeper understanding of how to leverage the stuff he still has.
