


Yirsandy Rodríguez
-
Posts
67 -
Joined
-
Last visited
Recent Profile Visitors
1,865 profile views
.thumb.jpeg.1a5b323fe15e9824ad40cee6189bd6d0.jpeg)


Yirsandy Rodríguez's Achievements


-
 Image courtesy of Wendell Cruz-Imagn Images The New York Mets’ season could well be divided into two completely different parts. First, the team’s initial stretch when they played to a 36-50 record between March and June, a disappointing run that sank the team’s expectations and inevitably turned them into sellers when the trade deadline arrived. When Carlos Mendoza was fired on June 26, one day after the 4-3, ten-inning loss to the Chicago Cubs at Citi Field, the Mets were playing to a 34-47 record. After that, managed by Andy Green, who was recently named the team’s full-time manager on a three-year contract, they played basically .500 ball with a 40-41 record. The results have been much more encouraging with Green, as the team went 38-38 after the start of July, including a 27-24 mark after August 1. With no chance to compete for a return to the postseason, the Mets gave several promising players an opportunity down the stretch. At the same time, they received some interesting signals during the second half of this season that generated some key expectations looking ahead to the 2027 season. Carson Benge and A.J. Ewing Rebuild Mets' Outfield In One Season Benge had a rookie season that exceeded my expectations. He posted a 118 wRC+ and 4.3 fWAR all while becoming the first rookie with a 20-20 season in franchise history. But when I look at his performance, the first number that, in a certain way, makes me think is his 654 plate appearances. At 23 years old, he has been an everyday player and his consistency adds much more value to his performance in his rookie season. But it was in this second half of the season when Benge surprised the most, batting .310/.373/.471, with nine home runs, 34 RBIs and a 136 wRC+ in 62 games. But offensive value is not the only way Benge impacts the game. The great defensive complement that has made him the most powerful arm in the game and one of the best outfielders in the league also comes into play. Statcast credits him with +7 defensive runs, the best mark in MLB, with +8 runs generated by runners thrown out and +7 by keeping them at their base. He has had the impressive ability to change games with his throws, standing out in both power and accuracy, in addition to his ability to move around the outfield. And this is where Ewing also enters the conversation. Ewing, 21, recorded 2.0 fWAR and a 97 wRC+ in 492 plate appearances during his rookie season, joining Benge to form a duo that has stabilized the Mets’ defense following the departures of Luis Robert Jr. and Tyrone Taylor. Ewing has struggled offensively—mostly with problems against breaking balls—seeing his wRC+ fall from 121 in the first half to just 77 after the All-Star break, but his defense has been above average, recording +2 FRV. Although his tools have not been on Benge’s level, Ewing has enough talent to take a leap to another level in the future. Daniel Duarte and Nate Lavender Emerge As Relief Aces Duarte and Lavender were not only the two pitchers with the most innings accumulated in this second half of the season in the Mets’ bullpen, they also lead with a combined 1.4 fWAR, which represents 74% of the 1.9 fWAR recorded by all of the team’s relievers. The other 21 pitchers the Mets have used combine for 0.5 fWAR. Still, there is a difference between Duarte and Lavender that could shape a decision going forward. In high-leverage situations, Duarte was vulnerable, seeing his xFIP rise from 3.84 to 6.21 in 21 matchups. It may seem like a small sample, but it is equivalent to an average of one key at-bat for each of the 21 relief appearances he has made in this second half of the season. In fact, Duarte has been the pitcher who has faced the most pressure situations in the entire Mets bullpen. Duarte has shown that he can rely on his almost unhittable sweeper—opponents went 2-for-27 with 15 strikeouts against it—but he still has not been able to make the adjustments with his cutter. In contrast, Lavender was a master under pressure, with a 2.42 xFIP (the best on the team with at least 10 batters faced in high-leverage situations), a 12.3 K/9 rate and no walks. Kodai Senga Saves His Career With Switch To Bullpen Look, I’ll be honest: I still don’t trust Senga enough, but it is a fact that he solved some of his control problems, struck out more batters, and was much more effective in a relief role. After his fateful start, when he pitched to an 0-8 record and 8.66 ERA with a 6.50 FIP in his first 13 appearances of the season, Senga was able to hold his own after being moved into the closer role. In his next 18 outings, he recorded eight saves in nine opportunities, improving to a 3.78 ERA and 4.00 FIP. The Mets played to a 13-5 record during that stretch with Senga’s contribution as the closer. The forkball remains the Japanese right-hander’s lethal weapon, with which he has struck out 56% of his opponents (42 of 75), but his fastball remains an enigma, and hitters have crushed his sweeper and cutter, batting .500 and .345, respectively. I’d like to know what you think, but I still haven’t gotten used to the idea of Senga being the most suitable pitcher to be the closer in the future. Either way, he seems to have regained a little confidence, and I’m sure this version of him can be useful in some type of role within the pitching staff for the 2027 season. View full article
 -
3 Most Important Takeaways From Mets' Impressive Second Half
Yirsandy Rodríguez posted an article in Mets
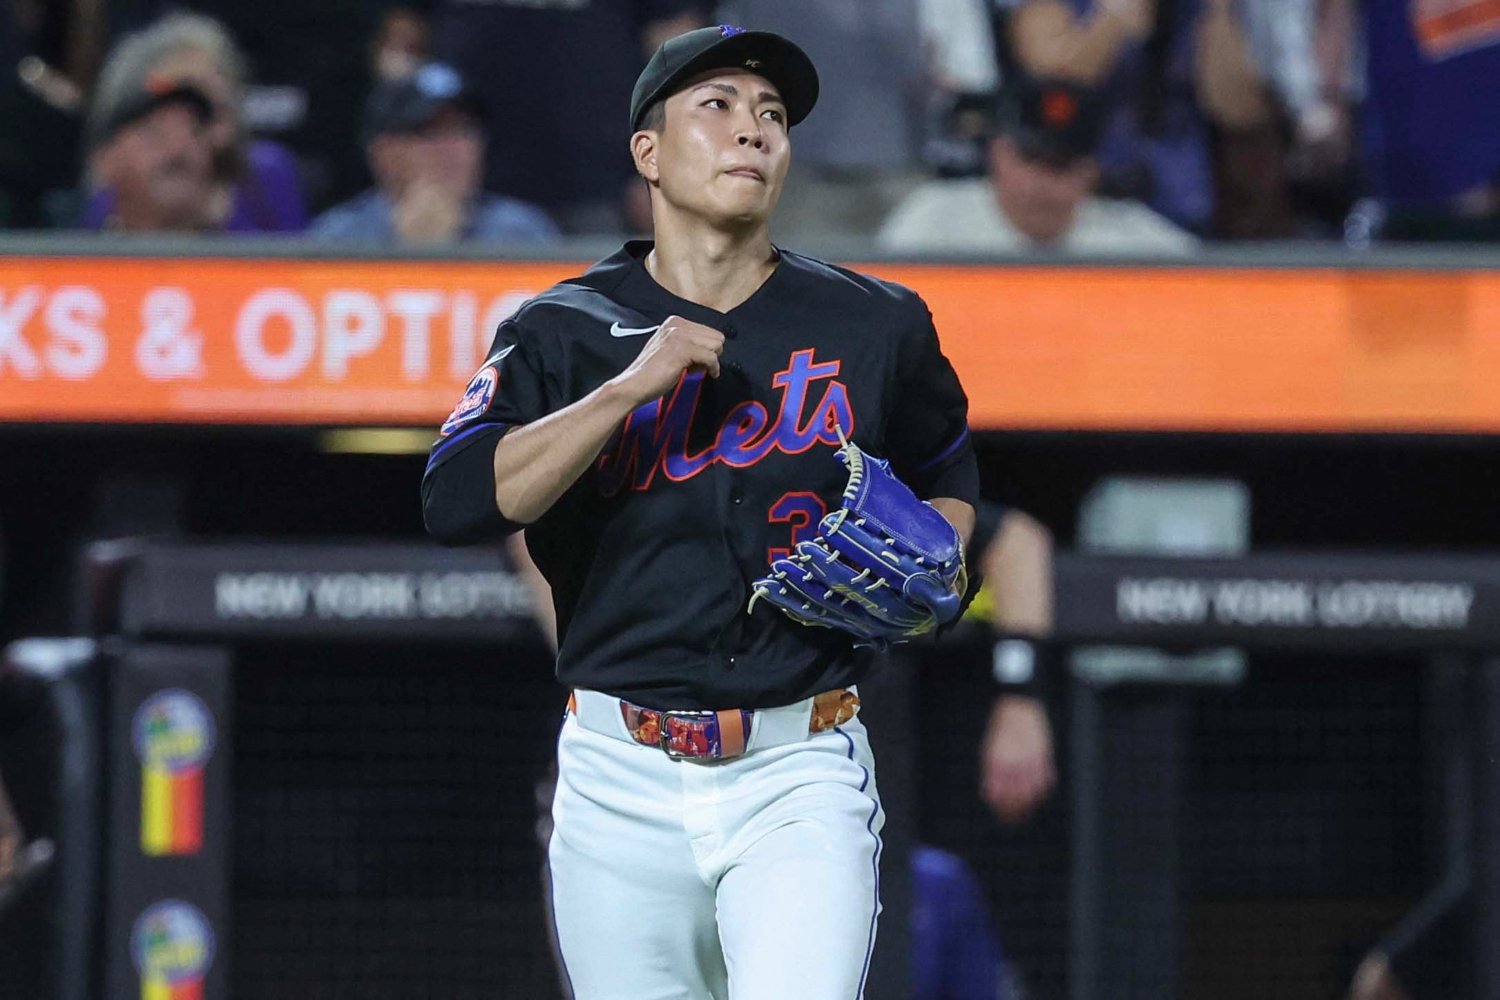 The New York Mets’ season could well be divided into two completely different parts. First, the team’s initial stretch when they played to a 36-50 record between March and June, a disappointing run that sank the team’s expectations and inevitably turned them into sellers when the trade deadline arrived. When Carlos Mendoza was fired on June 26, one day after the 4-3, ten-inning loss to the Chicago Cubs at Citi Field, the Mets were playing to a 34-47 record. After that, managed by Andy Green, who was recently named the team’s full-time manager on a three-year contract, they played basically .500 ball with a 40-41 record. The results have been much more encouraging with Green, as the team went 38-38 after the start of July, including a 27-24 mark after August 1. With no chance to compete for a return to the postseason, the Mets gave several promising players an opportunity down the stretch. At the same time, they received some interesting signals during the second half of this season that generated some key expectations looking ahead to the 2027 season. Carson Benge and A.J. Ewing Rebuild Mets' Outfield In One Season Benge had a rookie season that exceeded my expectations. He posted a 118 wRC+ and 4.3 fWAR all while becoming the first rookie with a 20-20 season in franchise history. But when I look at his performance, the first number that, in a certain way, makes me think is his 654 plate appearances. At 23 years old, he has been an everyday player and his consistency adds much more value to his performance in his rookie season. But it was in this second half of the season when Benge surprised the most, batting .310/.373/.471, with nine home runs, 34 RBIs and a 136 wRC+ in 62 games. But offensive value is not the only way Benge impacts the game. The great defensive complement that has made him the most powerful arm in the game and one of the best outfielders in the league also comes into play. Statcast credits him with +7 defensive runs, the best mark in MLB, with +8 runs generated by runners thrown out and +7 by keeping them at their base. He has had the impressive ability to change games with his throws, standing out in both power and accuracy, in addition to his ability to move around the outfield. And this is where Ewing also enters the conversation. Ewing, 21, recorded 2.0 fWAR and a 97 wRC+ in 492 plate appearances during his rookie season, joining Benge to form a duo that has stabilized the Mets’ defense following the departures of Luis Robert Jr. and Tyrone Taylor. Ewing has struggled offensively—mostly with problems against breaking balls—seeing his wRC+ fall from 121 in the first half to just 77 after the All-Star break, but his defense has been above average, recording +2 FRV. Although his tools have not been on Benge’s level, Ewing has enough talent to take a leap to another level in the future. Daniel Duarte and Nate Lavender Emerge As Relief Aces Duarte and Lavender were not only the two pitchers with the most innings accumulated in this second half of the season in the Mets’ bullpen, they also lead with a combined 1.4 fWAR, which represents 74% of the 1.9 fWAR recorded by all of the team’s relievers. The other 21 pitchers the Mets have used combine for 0.5 fWAR. Still, there is a difference between Duarte and Lavender that could shape a decision going forward. In high-leverage situations, Duarte was vulnerable, seeing his xFIP rise from 3.84 to 6.21 in 21 matchups. It may seem like a small sample, but it is equivalent to an average of one key at-bat for each of the 21 relief appearances he has made in this second half of the season. In fact, Duarte has been the pitcher who has faced the most pressure situations in the entire Mets bullpen. Duarte has shown that he can rely on his almost unhittable sweeper—opponents went 2-for-27 with 15 strikeouts against it—but he still has not been able to make the adjustments with his cutter. In contrast, Lavender was a master under pressure, with a 2.42 xFIP (the best on the team with at least 10 batters faced in high-leverage situations), a 12.3 K/9 rate and no walks. Kodai Senga Saves His Career With Switch To Bullpen Look, I’ll be honest: I still don’t trust Senga enough, but it is a fact that he solved some of his control problems, struck out more batters, and was much more effective in a relief role. After his fateful start, when he pitched to an 0-8 record and 8.66 ERA with a 6.50 FIP in his first 13 appearances of the season, Senga was able to hold his own after being moved into the closer role. In his next 18 outings, he recorded eight saves in nine opportunities, improving to a 3.78 ERA and 4.00 FIP. The Mets played to a 13-5 record during that stretch with Senga’s contribution as the closer. The forkball remains the Japanese right-hander’s lethal weapon, with which he has struck out 56% of his opponents (42 of 75), but his fastball remains an enigma, and hitters have crushed his sweeper and cutter, batting .500 and .345, respectively. I’d like to know what you think, but I still haven’t gotten used to the idea of Senga being the most suitable pitcher to be the closer in the future. Either way, he seems to have regained a little confidence, and I’m sure this version of him can be useful in some type of role within the pitching staff for the 2027 season.
 -
 Yirsandy Rodríguez reacted to a post in a topic:
A.J. Ewing's Summer Slump Is Both Multitudinous and Fixable
Yirsandy Rodríguez reacted to a post in a topic:
A.J. Ewing's Summer Slump Is Both Multitudinous and Fixable
-
Yirsandy Rodríguez reacted to a post in a topic:
Mets Have Major Defensive Questions To Answer Heading Into 2027
-
 smg58 reacted to a post in a topic:
Mets Have Major Defensive Questions To Answer Heading Into 2027
smg58 reacted to a post in a topic:
Mets Have Major Defensive Questions To Answer Heading Into 2027
-
Image courtesy of Steven Bisig-Imagn Images After a season in which several of the New York Mets’ main expectations have resulted in failure, the organization will have to resolve many questions heading into 2027. Some of the most important problems are not about reconfiguring the pitching rotation and finding the best offensive options, though. Throughout the year, defense has been one of the team’s weakest points. This year, the Mets have been close to finishing with their second consecutive season registering a negative FRV. The drop from 2024 to 2026 has been very significant, and they are about to close this campaign with the worst range mark (-18) among their infield and outfield players. Let’s start with the best part, which has been the catching position with the great work of Luis Torrens and, although to a lesser extent, Francisco Álvarez, who has played above average. Torrens is also among the best catchers in MLB, ranking ninth in Catcher Framing Runs (+5), Blocks Above Average (+6), and 12th in Catcher’s CS Above Average (+3). However, the additions of Bo Bichette at third base, Marcus Semien at second, and Jorge Polanco’s short time at first base were a failure. A difficult season could have been expected from Bichette, given his adjustment to a position change to third base. But Semien was coming off a +8 FRV season with the Texas Rangers and winning a Gold Glove. As the metrics show, he has been the Mets’ worst defender all season, far behind the contributions of Jeff McNeil (+2) in 2025. Regarding Bichette, I don’t think we should be that surprised given his history as a shortstop with the Toronto Blue Jays. His –1 FRV does not look that bad if we compare it with his entire defensive history, and we have to keep in mind that it combines all of Bichette’s work this year. We cannot forget that his playing time has been divided into 893 innings as a third baseman and 391 at shortstop, when Francisco Lindor was on the injured list. So, in what was supposed to be his full-time position this year, Bichette was much better, recording a +1 FRV at the hot corner, far better than his mark of –2 at shortstop. Lindor, after his return, has been an average player, falling below the value he usually provides. The infield problems are completed by a long list of experiments at first base, where Mark Vientos (-7) was as deficient as Pete Alonso (-7) was last year. Jared Young and even Luis Torrens have provided better value in the short time they played at first. Likewise, Young and Brett Baty have added defensive depth by playing several positions. Entering the outfield analysis, I wonder where the Mets would be without Carson Benge and A.J. Ewing, who have worked wonders defensively in addition to saving multiple plays with the strength of their arms. Benge’s arm is among the best of all right fielders in the league, while Ewing has impressed with his range. In contrast, in his return to left field, Juan Soto has been a defensive weakness (-5 FRV). Still, his presence on that side of the grass has cost the Mets fewer runs compared to his previous season in right field, when he finished with –13 FRV. I still believe that if Soto manages to stay healthy and works with the consistency that characterizes him, perhaps he can improve his defense a little more in his second year back at his old position. But, as we have seen here, the Mets have many questions to answer about how they are going to improve the team at several key positions, especially with the different defensive problems of Bichette, Semien and Polanco, three of their infield starters. View full article
- 1 reply
-
- 1
-
-
- juan soto
- bo bichette
- (and 4 more)
-
Mets Have Major Defensive Questions To Answer Heading Into 2027
Yirsandy Rodríguez posted an article in Mets
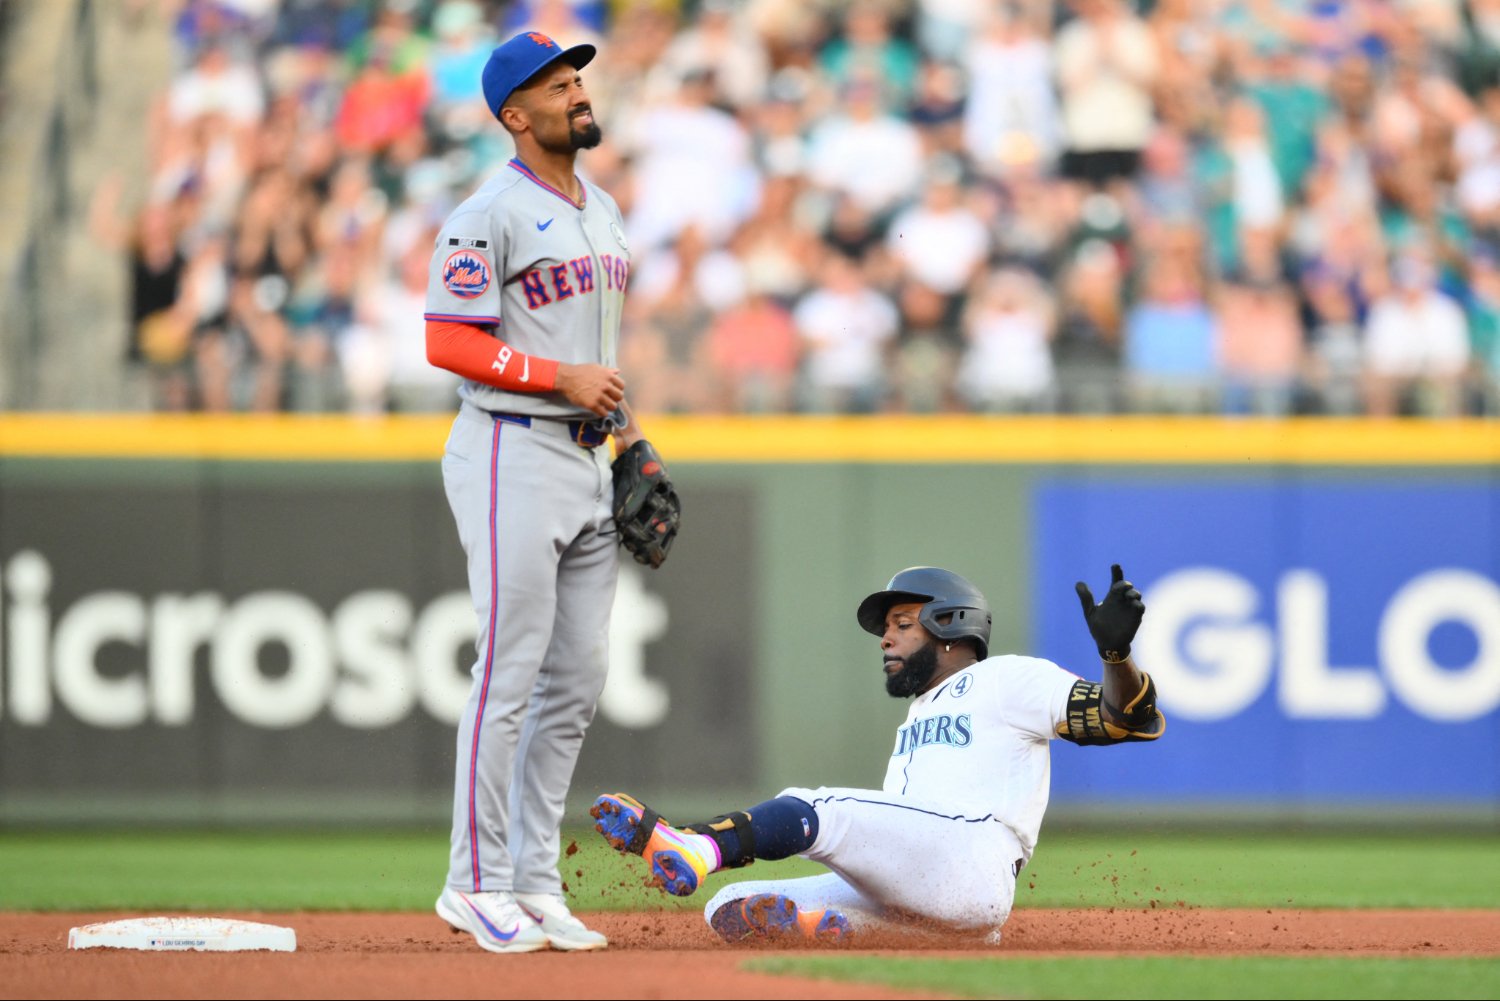 After a season in which several of the New York Mets’ main expectations have resulted in failure, the organization will have to resolve many questions heading into 2027. Some of the most important problems are not about reconfiguring the pitching rotation and finding the best offensive options, though. Throughout the year, defense has been one of the team’s weakest points. This year, the Mets have been close to finishing with their second consecutive season registering a negative FRV. The drop from 2024 to 2026 has been very significant, and they are about to close this campaign with the worst range mark (-18) among their infield and outfield players. Let’s start with the best part, which has been the catching position with the great work of Luis Torrens and, although to a lesser extent, Francisco Álvarez, who has played above average. Torrens is also among the best catchers in MLB, ranking ninth in Catcher Framing Runs (+5), Blocks Above Average (+6), and 12th in Catcher’s CS Above Average (+3). However, the additions of Bo Bichette at third base, Marcus Semien at second, and Jorge Polanco’s short time at first base were a failure. A difficult season could have been expected from Bichette, given his adjustment to a position change to third base. But Semien was coming off a +8 FRV season with the Texas Rangers and winning a Gold Glove. As the metrics show, he has been the Mets’ worst defender all season, far behind the contributions of Jeff McNeil (+2) in 2025. Regarding Bichette, I don’t think we should be that surprised given his history as a shortstop with the Toronto Blue Jays. His –1 FRV does not look that bad if we compare it with his entire defensive history, and we have to keep in mind that it combines all of Bichette’s work this year. We cannot forget that his playing time has been divided into 893 innings as a third baseman and 391 at shortstop, when Francisco Lindor was on the injured list. So, in what was supposed to be his full-time position this year, Bichette was much better, recording a +1 FRV at the hot corner, far better than his mark of –2 at shortstop. Lindor, after his return, has been an average player, falling below the value he usually provides. The infield problems are completed by a long list of experiments at first base, where Mark Vientos (-7) was as deficient as Pete Alonso (-7) was last year. Jared Young and even Luis Torrens have provided better value in the short time they played at first. Likewise, Young and Brett Baty have added defensive depth by playing several positions. Entering the outfield analysis, I wonder where the Mets would be without Carson Benge and A.J. Ewing, who have worked wonders defensively in addition to saving multiple plays with the strength of their arms. Benge’s arm is among the best of all right fielders in the league, while Ewing has impressed with his range. In contrast, in his return to left field, Juan Soto has been a defensive weakness (-5 FRV). Still, his presence on that side of the grass has cost the Mets fewer runs compared to his previous season in right field, when he finished with –13 FRV. I still believe that if Soto manages to stay healthy and works with the consistency that characterizes him, perhaps he can improve his defense a little more in his second year back at his old position. But, as we have seen here, the Mets have many questions to answer about how they are going to improve the team at several key positions, especially with the different defensive problems of Bichette, Semien and Polanco, three of their infield starters.
 -
Yirsandy Rodríguez reacted to a post in a topic:
Luis Torrens Has Morphed Into Baseball's Best Backup Catcher
-
Yirsandy Rodríguez reacted to a post in a topic:
Mark Vientos Has One Path To Remain In Mets' Plans For 2027 and Beyond
-
Yirsandy Rodríguez reacted to a post in a topic:
Mark Vientos Has One Path To Remain In Mets' Plans For 2027 and Beyond
-
whippoorwill reacted to a post in a topic:
Mark Vientos Has One Path To Remain In Mets' Plans For 2027 and Beyond
-
smg58 reacted to a post in a topic:
Mark Vientos Has One Path To Remain In Mets' Plans For 2027 and Beyond
-
Yirsandy Rodríguez reacted to a post in a topic:
Luis Torrens Has Morphed Into Baseball's Best Backup Catcher
-
MFS62 reacted to a post in a topic:
Mark Vientos Has One Path To Remain In Mets' Plans For 2027 and Beyond
-
Image courtesy of John Jones-Imagn Images If we judged Mark Vientos’ season by simply looking at his .218/.267/.405 line that comes with 13 home runs, 39 RBIs, a 84 wRC+ and –0.1 fWAR, it would be easy to reach the conclusion that it has been a mediocre year at best. And, yes, Vientos has never come close to being the hitter who impressed when he hit 27 home runs in the 2024 season, and then played the postseason like a veteran accustomed to being under the October lights. Since then, his offense has fallen below expectations. It is true that he has had to battle injuries, but in his playing time he has been a negative player for the team in any way you analyze his contribution. I love FanGraphs for this type of breakdown, and there you can see Vientos with -1.3 BsR, -6.7 Off and -11.8 Def. In other words, he's been a below-average player in every aspect of the game in 2026. He has not been able to take advantage of the opportunity to move to first base, and the metrics show that he has been a disaster. Among 86 qualified first basemen, Vientos is second with the worst Fielding Run Value (-7), being surpassed only by Bryce Harper (-10). That is the reason why the Mets have been one of the teams with the most first basemen used, and all of them have put on a better defensive performance than Vientos. Jared Young (+1), Brett Baty (-2) and even catcher Luis Torrens (+0) average a higher Fielding Run Value. In fact, the only defensive aspect in which Vientos has excelled is in the new First Base Receiving metric, where he ranks 15th with +1 Receiving OAA. Either way, the point here is that Vientos is not producing anything the Mets need out of a franchise cornerstone at the cold corner. If we look toward 2027, there is only one way for his offensive profile to fit into the lineup. It is the only skill Vientos has not yet lost, and it is his ability to hit against left-handed pitchers. At the same time, that has been one of the Mets’ main problems, as their right-handed hitters have registered the second-lowest BABIP (.268) against left-handed pitchers in the entire league, the third-worst on-base percentage (.301), and the ninth-worst wRC+ (96). Name wRC+ G PA HR RBI BB% K% ISO BABIP wOBA Mark Vientos 140 57 111 8 21 6.3% 20.7% .284 .278 .375 Bo Bichette 111 90 177 6 23 8.5% 16.9% .181 .286 .333 Luis Torrens 104 47 81 4 14 7.4% 19.8% .205 .245 .323 Marcus Semien 88 75 138 3 11 10.9% 21.0% .108 .278 .298 Francisco Lindor 87 59 130 5 13 11.5% 14.6% .174 .198 .297 Francisco Alvarez 70 60 108 3 7 12.0% 34.3% .106 .278 .271 Here are all the Mets’ qualified right-handed hitters with at least 80 plate appearances against left-handed pitchers this season. Vientos leads in the main production metrics, and his wRC+ and ISO are among the top 20 in the entire league. This is not a new story for the Mets, as Vientos has always been consistent against southpaws (even if he's rarely ever been so against right-handers). Handedness BB/K ISO wOBA wRC+ Season Handedness BB/K ISO wOBA wRC+ vs R 0.13 .000 .129 -21 2022 vs L 1.00 .222 .357 135 vs R 0.20 .172 .278 75 2023 vs L 0.07 .131 .250 56 vs R 0.27 .251 .347 125 2024 vs L 0.19 .246 .375 144 vs R 0.27 .169 .299 92 2025 vs L 0.23 .203 .315 104 vs R 0.19 .123 .236 47 2026 vs L 0.30 .284 .375 140 vs R 0.24 .184 .297 90 Total vs L 0.21 .221 .336 116 In 2024, his breakout season, it was the only one in which Vientos managed to find the balance when he recorded a 125 wRC+ with 20 of his 27 home runs against right-handed pitchers. During the following campaigns, you can see how his performance has hinged almost entirely on his ability to crush left-handed pitching. The main potential of the Mets’ lineup is in their left-handed and switch-hitting batters, led by Juan Soto, Francisco Lindor, Carson Benge, A.J. Ewing, and Jorge Polanco (plus Jared Young and Brett Baty). In that plan for 2027, Vientos fits as a high-profile right-handed platoon hitter. That may not be quite the role we all envisioned when he was a top-tier prospect rising through the farm system, but it appears to be his best bet to salvaging his tenure with the Mets. View full article
-
Mark Vientos Has One Path To Remain In Mets' Plans For 2027 and Beyond
Yirsandy Rodríguez posted an article in Mets
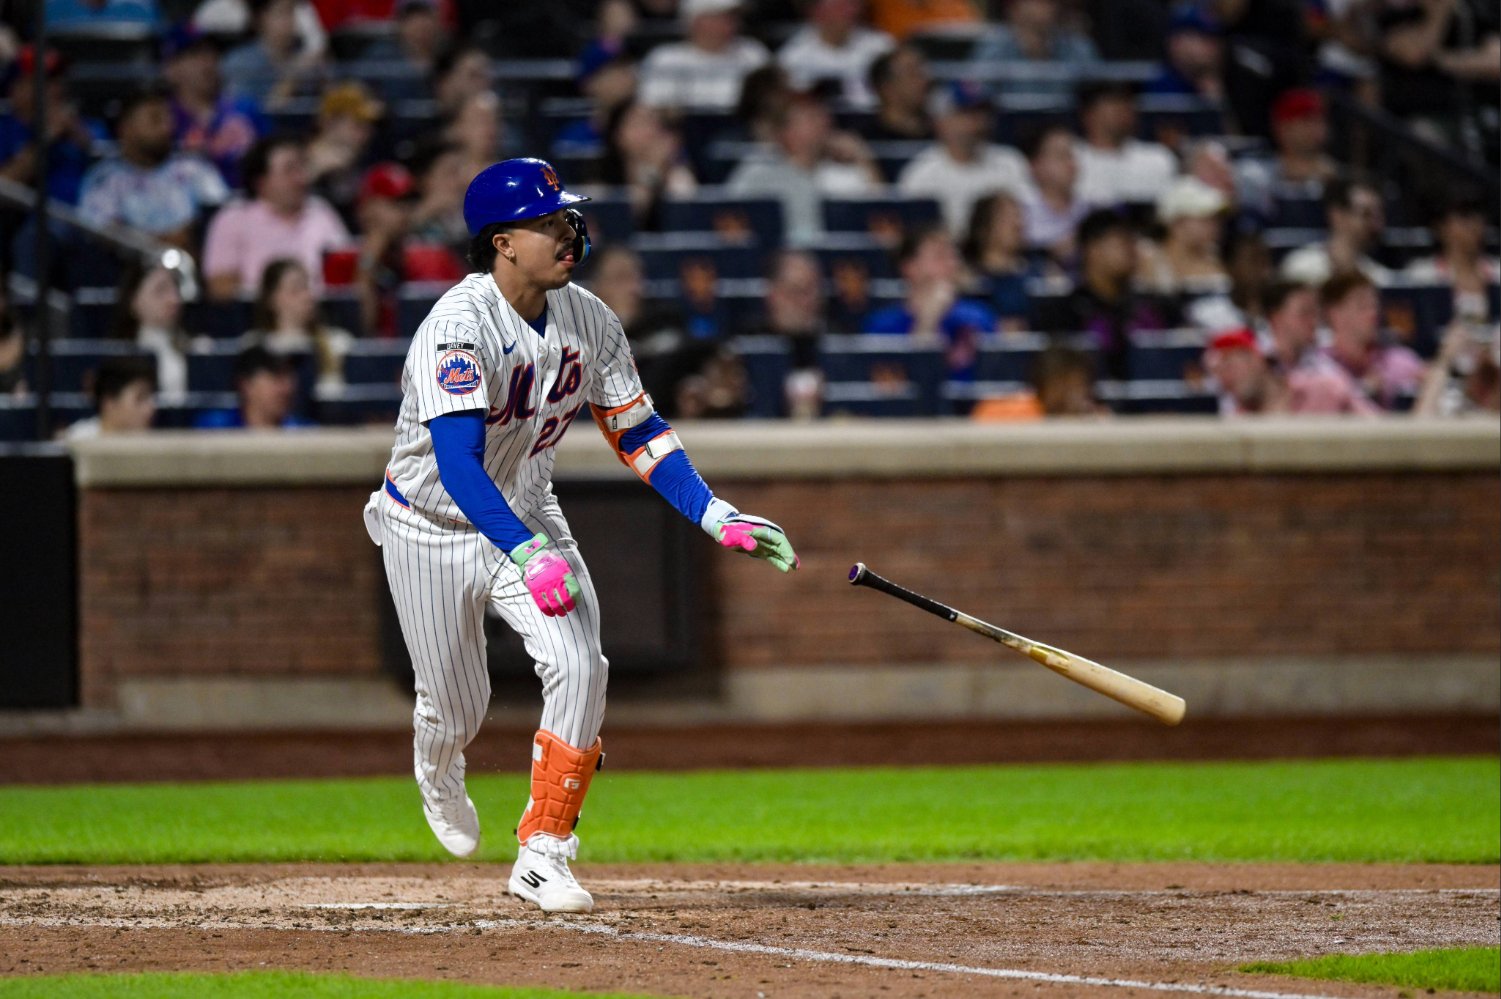 If we judged Mark Vientos’ season by simply looking at his .218/.267/.405 line that comes with 13 home runs, 39 RBIs, a 84 wRC+ and –0.1 fWAR, it would be easy to reach the conclusion that it has been a mediocre year at best. And, yes, Vientos has never come close to being the hitter who impressed when he hit 27 home runs in the 2024 season, and then played the postseason like a veteran accustomed to being under the October lights. Since then, his offense has fallen below expectations. It is true that he has had to battle injuries, but in his playing time he has been a negative player for the team in any way you analyze his contribution. I love FanGraphs for this type of breakdown, and there you can see Vientos with -1.3 BsR, -6.7 Off and -11.8 Def. In other words, he's been a below-average player in every aspect of the game in 2026. He has not been able to take advantage of the opportunity to move to first base, and the metrics show that he has been a disaster. Among 86 qualified first basemen, Vientos is second with the worst Fielding Run Value (-7), being surpassed only by Bryce Harper (-10). That is the reason why the Mets have been one of the teams with the most first basemen used, and all of them have put on a better defensive performance than Vientos. Jared Young (+1), Brett Baty (-2) and even catcher Luis Torrens (+0) average a higher Fielding Run Value. In fact, the only defensive aspect in which Vientos has excelled is in the new First Base Receiving metric, where he ranks 15th with +1 Receiving OAA. Either way, the point here is that Vientos is not producing anything the Mets need out of a franchise cornerstone at the cold corner. If we look toward 2027, there is only one way for his offensive profile to fit into the lineup. It is the only skill Vientos has not yet lost, and it is his ability to hit against left-handed pitchers. At the same time, that has been one of the Mets’ main problems, as their right-handed hitters have registered the second-lowest BABIP (.268) against left-handed pitchers in the entire league, the third-worst on-base percentage (.301), and the ninth-worst wRC+ (96). Name wRC+ G PA HR RBI BB% K% ISO BABIP wOBA Mark Vientos 140 57 111 8 21 6.3% 20.7% .284 .278 .375 Bo Bichette 111 90 177 6 23 8.5% 16.9% .181 .286 .333 Luis Torrens 104 47 81 4 14 7.4% 19.8% .205 .245 .323 Marcus Semien 88 75 138 3 11 10.9% 21.0% .108 .278 .298 Francisco Lindor 87 59 130 5 13 11.5% 14.6% .174 .198 .297 Francisco Alvarez 70 60 108 3 7 12.0% 34.3% .106 .278 .271 Here are all the Mets’ qualified right-handed hitters with at least 80 plate appearances against left-handed pitchers this season. Vientos leads in the main production metrics, and his wRC+ and ISO are among the top 20 in the entire league. This is not a new story for the Mets, as Vientos has always been consistent against southpaws (even if he's rarely ever been so against right-handers). Handedness BB/K ISO wOBA wRC+ Season Handedness BB/K ISO wOBA wRC+ vs R 0.13 .000 .129 -21 2022 vs L 1.00 .222 .357 135 vs R 0.20 .172 .278 75 2023 vs L 0.07 .131 .250 56 vs R 0.27 .251 .347 125 2024 vs L 0.19 .246 .375 144 vs R 0.27 .169 .299 92 2025 vs L 0.23 .203 .315 104 vs R 0.19 .123 .236 47 2026 vs L 0.30 .284 .375 140 vs R 0.24 .184 .297 90 Total vs L 0.21 .221 .336 116 In 2024, his breakout season, it was the only one in which Vientos managed to find the balance when he recorded a 125 wRC+ with 20 of his 27 home runs against right-handed pitchers. During the following campaigns, you can see how his performance has hinged almost entirely on his ability to crush left-handed pitching. The main potential of the Mets’ lineup is in their left-handed and switch-hitting batters, led by Juan Soto, Francisco Lindor, Carson Benge, A.J. Ewing, and Jorge Polanco (plus Jared Young and Brett Baty). In that plan for 2027, Vientos fits as a high-profile right-handed platoon hitter. That may not be quite the role we all envisioned when he was a top-tier prospect rising through the farm system, but it appears to be his best bet to salvaging his tenure with the Mets.
 -
Image courtesy of Sam Navarro-Imagn Images There was a moment in late July when Francisco Alvarez had found his best rhythm at the plate. Remember, he had suffered a right meniscus tear on May 12, 2026. He underwent surgery two days later and, although the New York Mets estimated that the absence would last between six and eight weeks, he returned in just four, after a brief rehab assignment. Then the Mets became sellers at the trade deadline, and the season took a turn from that moment on. The pressure of competing to reach the postseason had disappeared, which took away a great deal of pressure when facing the rest of the schedule. After posting a 124 wRC+ in June, Álvarez put together his best numbers in July when he hit .267/.405/.433, with a 138 wRC+ and a 17.6 BB% rate, his best rate of any month this season. Expectations seemed high for the rest of the season, especially after seeing how he was responding offensively after overcoming the injury that sidelined him in May. However, August arrived and Álvarez’s problems at the plate began to become more frequent. His strikeout rate jumped from 26.3% to 41.5%, his slugging fell 148 points, and his 116 wRC+ dropped to 51. The regression has not come from a decline in Álvarez’s quality of contact or a drastic change in his aggressiveness. His hard-hit rate between March/April and July was 39.6%, and since August it has risen slightly to 41.40%. Now, regarding his plate discipline, there are interesting details to highlight. Period O-Swing% Z-Swing% O-Contact% Z-Contact% K% ABR - JUL 34.7% 63.1% 55.6% 82.1% 26.3% AUG - SEP 34.0% 61.0% 48.2% 76.5% 41.5% As you can see here, Álvarez has maintained similar trends in both stretches regarding his swing decisions. The change has come in effectiveness, as he has fallen to a 7.4% rate in O-Swing% and 5.6% in Z-Swing%. This reduction in the reach of his swing leads us to the most concerning situation of all, his disproportionate 15.2% increase in his strikeout rate. Álvarez is having one of the worst seasons of his career against left-handed pitchers, posting just a 70 wRC+ this year, much of which is owed to his strikeout rate of 34.3% (which is nearly five percentage points above the 29.6% he has against right-handers). The turning point that illustrates the main breakdown is Álvarez’s terrible slump against fastballs. You probably still remember his 2023 season at age 21, when he became a revelation and hit 25 home runs. Of those, 15 came while crushing fastballs. His strikeout rates have always been high against velocity, and pitchers know it, but Álvarez used to compensate for the strikeouts with elite contact and high production. Part of that story has changed this season, and it has been the biggest problem for the Venezuelan catcher at the plate. Season PA HR HR/PA BA SLG xwOBA Whiff% K vs FB / Total K 2022 8 0 0.0% .167 .333 .427 31.3 25.0% 2023 226 15 6.6% .215 .485 .345 26.5 40.9% 2024 168 7 4.2% .310 .531 .369 22.3 43.0% 2025 145 6 4.1% .301 .488 .372 28.3 45.2% 2026 211 7 3.3% .230 .372 .331 31.4 55.4% The statistics are revealing: his whiff rate is at its highest point ever, his slugging fell from the minimum of .485 that he recorded in qualified seasons, and his home run rate also dropped to its lowest point. The K vs FB/Total K statistic shows us Álvarez’s average strikeouts against fastballs compared to his total strikeouts, and this has also been the worst year with a concerning rise to 55.4%. That means the league is striking him out exclusively with fastballs far more often than in 2025, when he had set his previous worst personal record in that regard. Although his injury at the beginning of the season is an unavoidable point here, Álvarez had shown that he was back, but the long-term results have not been sustainable. For the Mets, the impact of Álvarez’s regression has not been as catastrophic because Luis Torrens has had one of his best seasons in recent years. Torrens has posted a 101 wRC+ and 2.2 fWAR with nine home runs and 40 RBIs in 87 games, surpassing Álvarez’s contribution, who has 15 home runs and 37 RBIs, but has fallen to a 97 wRC+ and 1.4 fWAR. In terms of contribution, Torrens has also been superior with runners in scoring position, producing a 128 wRC+ compared to Álvarez’s mark of 68 (and he has not been able to hit home runs in those situations). Torrens’ case becomes even more unusual, as he is the hitter with the biggest difference in the entire league in terms of wRC+ in RISP situations compared to his production with the bases empty. In terms of defense as catchers, Torrens also has better results than Álvarez in terms of run prevention, allowing a 3.68 ERA compared to 4.61. Opponents have averaged a .683 OPS when Torrens is catching, compared to .747 with Álvarez. In addition, Torrens is also ahead in Catcher Framing Runs (6 to 3) and Catcher’s CS Above Average (4 to 2), although both belong to the elite group of catchers this season. Amid the chaos that Álvarez’s season has become since August, the good news for the Mets is that Torrens is emerging as a bona fide star. I still believe that Álvarez can be more consistent and deserves to be viewed as the long-term starter at the position, but it's impossible not to cede a little confidence to his veteran backup as the two trend in opposite directions down the stretch. View full article
-
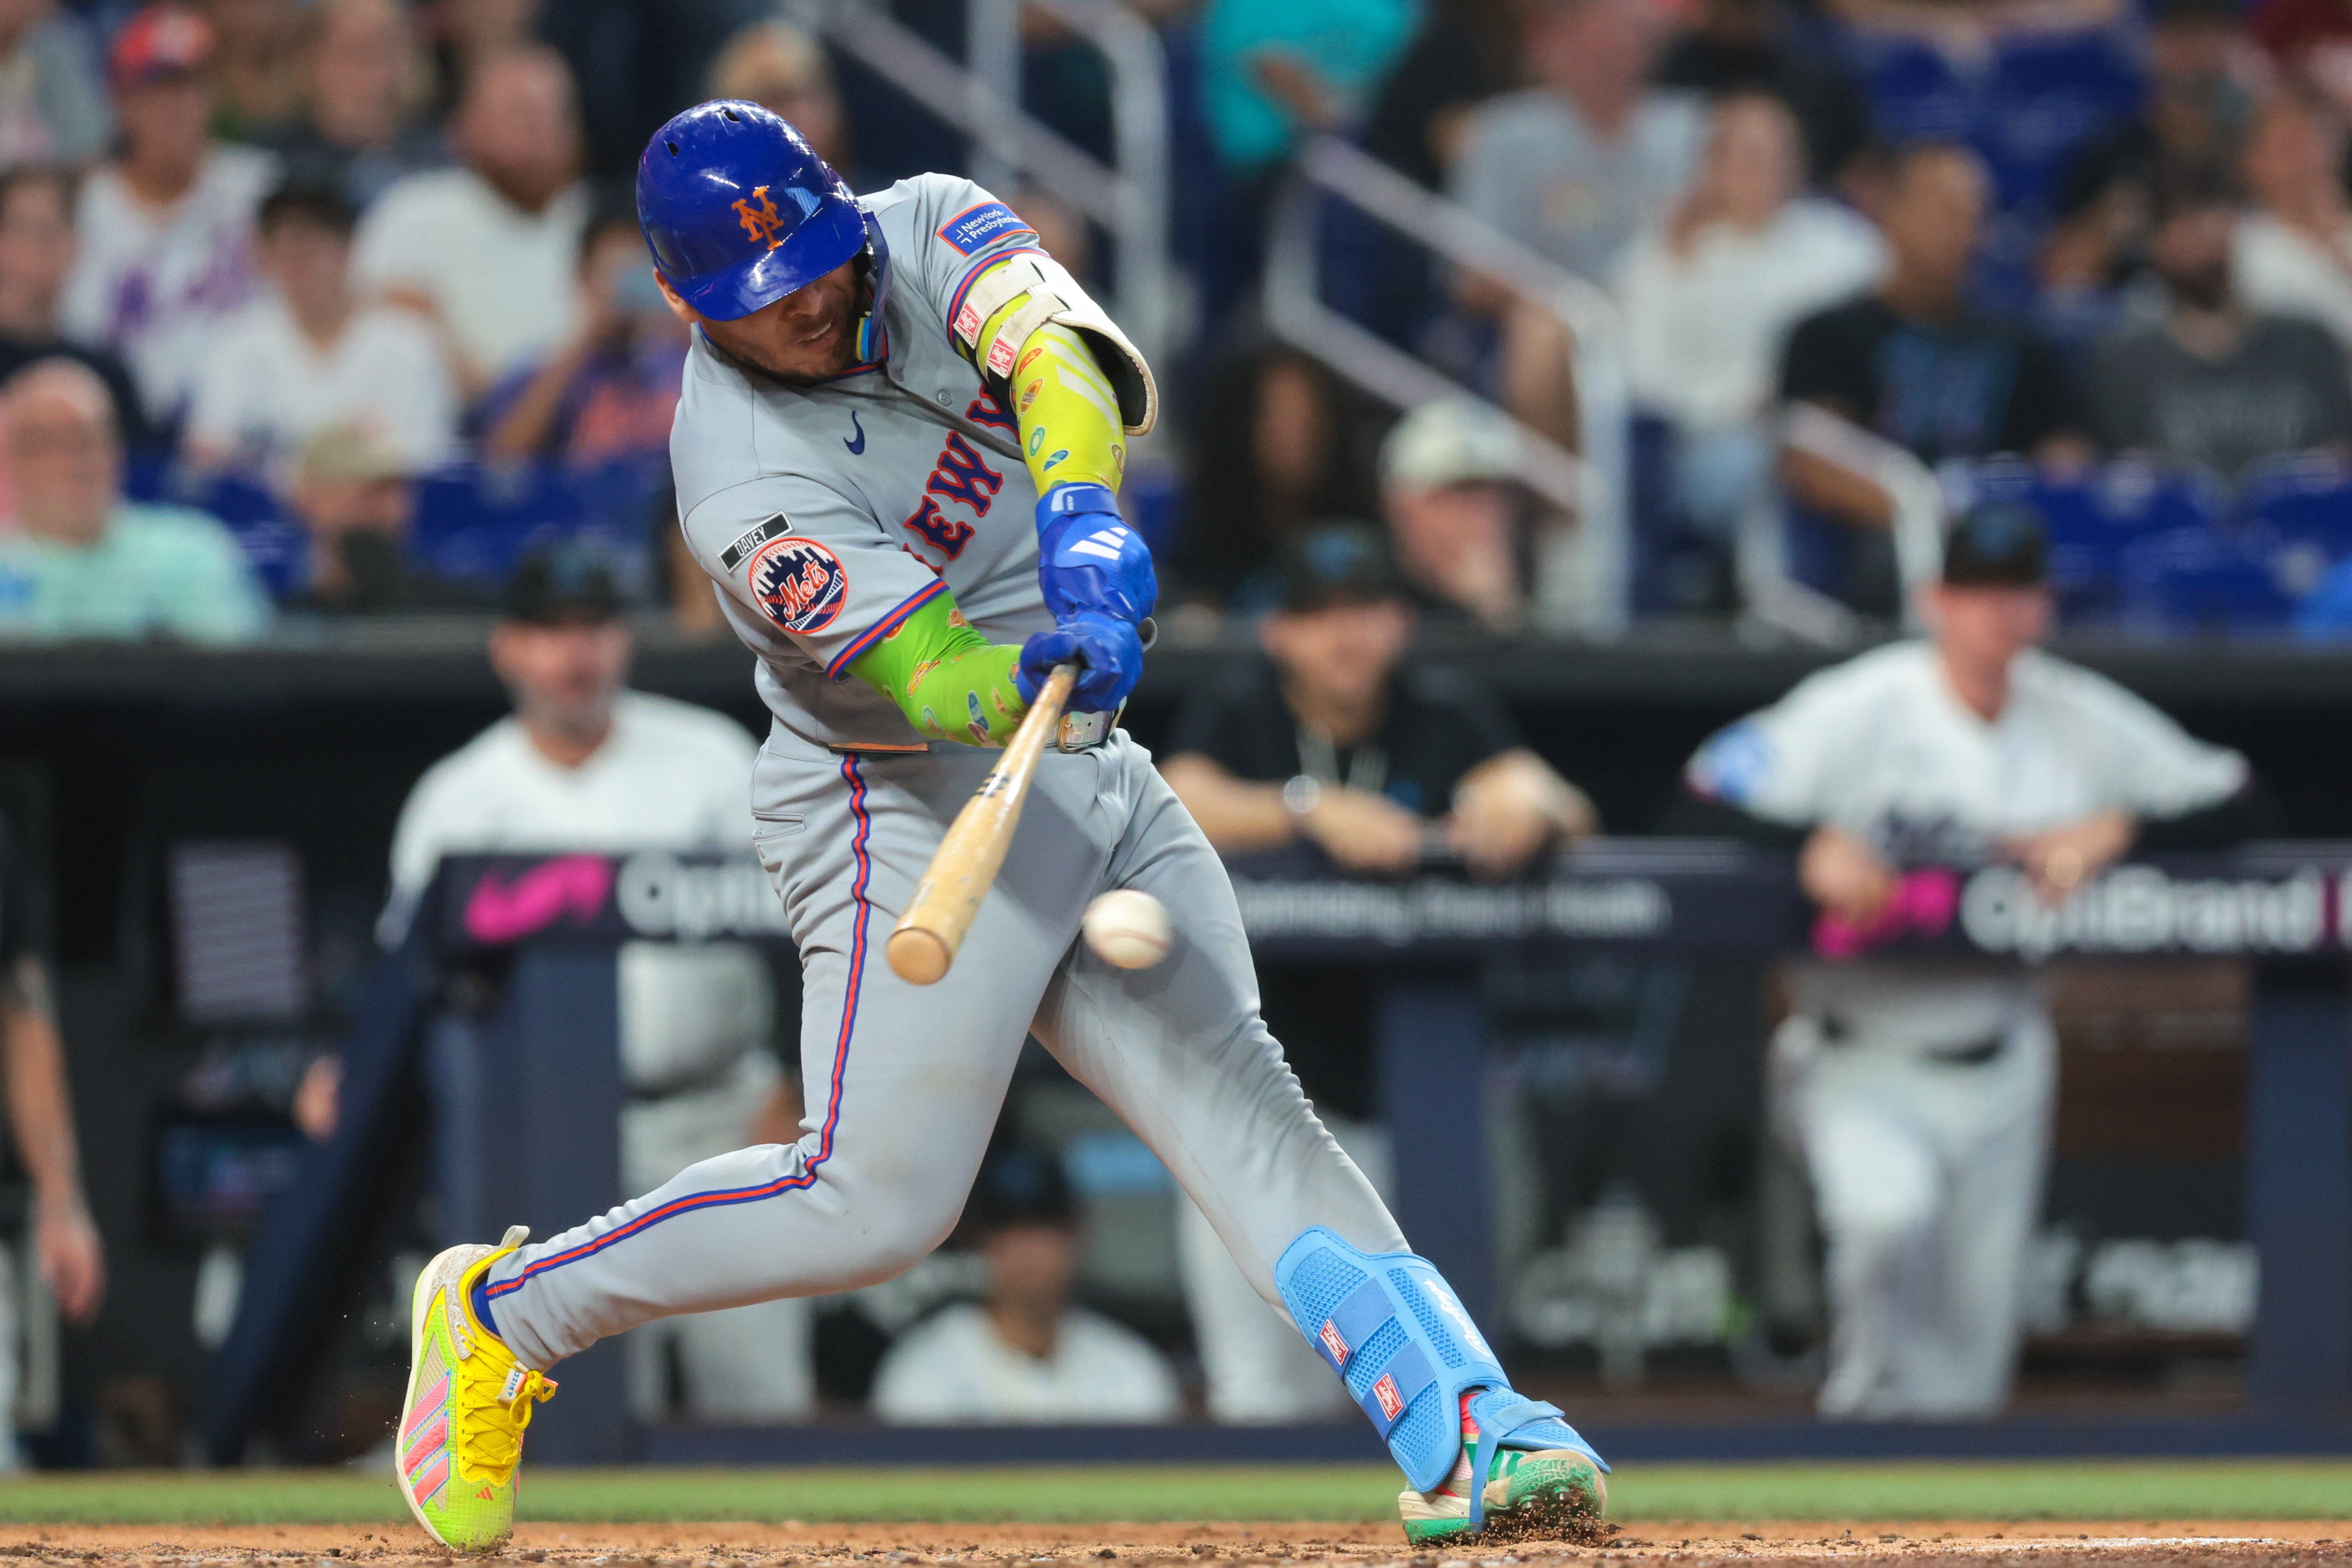 There was a moment in late July when Francisco Alvarez had found his best rhythm at the plate. Remember, he had suffered a right meniscus tear on May 12, 2026. He underwent surgery two days later and, although the New York Mets estimated that the absence would last between six and eight weeks, he returned in just four, after a brief rehab assignment. Then the Mets became sellers at the trade deadline, and the season took a turn from that moment on. The pressure of competing to reach the postseason had disappeared, which took away a great deal of pressure when facing the rest of the schedule. After posting a 124 wRC+ in June, Álvarez put together his best numbers in July when he hit .267/.405/.433, with a 138 wRC+ and a 17.6 BB% rate, his best rate of any month this season. Expectations seemed high for the rest of the season, especially after seeing how he was responding offensively after overcoming the injury that sidelined him in May. However, August arrived and Álvarez’s problems at the plate began to become more frequent. His strikeout rate jumped from 26.3% to 41.5%, his slugging fell 148 points, and his 116 wRC+ dropped to 51. The regression has not come from a decline in Álvarez’s quality of contact or a drastic change in his aggressiveness. His hard-hit rate between March/April and July was 39.6%, and since August it has risen slightly to 41.40%. Now, regarding his plate discipline, there are interesting details to highlight. Period O-Swing% Z-Swing% O-Contact% Z-Contact% K% ABR - JUL 34.7% 63.1% 55.6% 82.1% 26.3% AUG - SEP 34.0% 61.0% 48.2% 76.5% 41.5% As you can see here, Álvarez has maintained similar trends in both stretches regarding his swing decisions. The change has come in effectiveness, as he has fallen to a 7.4% rate in O-Swing% and 5.6% in Z-Swing%. This reduction in the reach of his swing leads us to the most concerning situation of all, his disproportionate 15.2% increase in his strikeout rate. Álvarez is having one of the worst seasons of his career against left-handed pitchers, posting just a 70 wRC+ this year, much of which is owed to his strikeout rate of 34.3% (which is nearly five percentage points above the 29.6% he has against right-handers). The turning point that illustrates the main breakdown is Álvarez’s terrible slump against fastballs. You probably still remember his 2023 season at age 21, when he became a revelation and hit 25 home runs. Of those, 15 came while crushing fastballs. His strikeout rates have always been high against velocity, and pitchers know it, but Álvarez used to compensate for the strikeouts with elite contact and high production. Part of that story has changed this season, and it has been the biggest problem for the Venezuelan catcher at the plate. Season PA HR HR/PA BA SLG xwOBA Whiff% K vs FB / Total K 2022 8 0 0.0% .167 .333 .427 31.3 25.0% 2023 226 15 6.6% .215 .485 .345 26.5 40.9% 2024 168 7 4.2% .310 .531 .369 22.3 43.0% 2025 145 6 4.1% .301 .488 .372 28.3 45.2% 2026 211 7 3.3% .230 .372 .331 31.4 55.4% The statistics are revealing: his whiff rate is at its highest point ever, his slugging fell from the minimum of .485 that he recorded in qualified seasons, and his home run rate also dropped to its lowest point. The K vs FB/Total K statistic shows us Álvarez’s average strikeouts against fastballs compared to his total strikeouts, and this has also been the worst year with a concerning rise to 55.4%. That means the league is striking him out exclusively with fastballs far more often than in 2025, when he had set his previous worst personal record in that regard. Although his injury at the beginning of the season is an unavoidable point here, Álvarez had shown that he was back, but the long-term results have not been sustainable. For the Mets, the impact of Álvarez’s regression has not been as catastrophic because Luis Torrens has had one of his best seasons in recent years. Torrens has posted a 101 wRC+ and 2.2 fWAR with nine home runs and 40 RBIs in 87 games, surpassing Álvarez’s contribution, who has 15 home runs and 37 RBIs, but has fallen to a 97 wRC+ and 1.4 fWAR. In terms of contribution, Torrens has also been superior with runners in scoring position, producing a 128 wRC+ compared to Álvarez’s mark of 68 (and he has not been able to hit home runs in those situations). Torrens’ case becomes even more unusual, as he is the hitter with the biggest difference in the entire league in terms of wRC+ in RISP situations compared to his production with the bases empty. In terms of defense as catchers, Torrens also has better results than Álvarez in terms of run prevention, allowing a 3.68 ERA compared to 4.61. Opponents have averaged a .683 OPS when Torrens is catching, compared to .747 with Álvarez. In addition, Torrens is also ahead in Catcher Framing Runs (6 to 3) and Catcher’s CS Above Average (4 to 2), although both belong to the elite group of catchers this season. Amid the chaos that Álvarez’s season has become since August, the good news for the Mets is that Torrens is emerging as a bona fide star. I still believe that Álvarez can be more consistent and deserves to be viewed as the long-term starter at the position, but it's impossible not to cede a little confidence to his veteran backup as the two trend in opposite directions down the stretch.
 -
Image courtesy of © Jim Rassol-Imagn Images There is a problem that has chased Sean Manaea for almost his entire career, but it's reached a new level in his last two seasons: the inability to survive when he falls behind in the count. This season, Manaea has allowed the fourth-highest OPS+ (129) among qualified pitchers with at least 180 batters faced, only behind Spencer Arrighetti (151), Shota Imanaga (142), and Joey Cantillo (136). Against Manaea, the big difference has been marked by right-handed hitters. This season, he has posted the lowest K/BB rate (11.4) and the worst xFIP (4.93) against them. His ability to generate ground balls has also fallen from 51.4 GB% against lefties to 33.7% against righties, who are also managing to make contact with pitches outside the strike zone 16.7% more than lefties. Behind all these inconsistencies appears the most concerning point about the 34-year-old left-hander with 11 seasons: his four-seam fastball is not adding the value he needs to avoid depending so much on the sweeper. Manaea has allowed 21 home runs this season and 14 of them have come against his fastball. Opponents are slugging .472 against him, the second-highest mark of his entire career since the .503 he allowed in 2016. Manaea’s inability against right-handed hitters carries the most weight in the offensive disaster he has allowed in his last two seasons with the New York Mets. If we compare the span of these two most recent seasons with the two previous ones, 2023-2024 vs. 2025-2026, we can find several interesting trends. It is important to keep in mind the notable differences between the 2023 Manaea with the Giants and 2024 in his first season with the Mets, and then the one we have seen over these last two years, when he missed practically the first half of the 2025 season. 2023-2024: 19-12, 3.85 ERA, 3.86 FIP and 3.1 bWAR 2025-2026: 7-11, 5.06 ERA, 4.46 FIP and –0.3 bWAR According to Baseball Reference data, these last two seasons mark the first time in Manaea’s entire career with two consecutive seasons of negative WAR. FanGraphs gives him much more credit, placing him at 0.4 fWAR in 2025 and 0.8 in 2026. However, it is clear that this decline from Manaea puts him in the worst stretch of his career, two seasons after posting 2.8 fWAR in 2024, the second-highest of his career. That said, let’s now get into the big challenge that Manaea is failing to overcome. Here is an interesting summary of the offense in the two periods against right-handed hitters when he falls behind in the count. Period Pitch % PA K% HR% BA OBP SLG BABIP Hard Hit% Whiffs% 2023-2024 18.7% 282 12.8% 1.8% .235 .461 .393 .261 42.6% 21.7% 2025-2026 17.5% 172 9.3% 4.1% .354 .515 .622 .362 43.4% 15.8% There are major differences that are notable: the growth in Manaea’s home run rate, and how, with a hard-hit rate that has increased by just 0.8%, right-handers have unleashed more contact and power. The 5.9% decline in the whiff rate does not go unnoticed, but the result of the at-bat suggests a much more difficult problem to reverse. The two graphs on the left belong to the 2023-2024 stretch, and the other two to the most recent one. In the first, we can observe more dominance from Manaea in several of the zones where he recorded the highest percentage of pitches. The high pitches, inside and on the outside corner worked for him. Everything changed in the following stretch. That similar tendency to throw the fastball against right-handers at a high point outside the zone, well inside or far and outside, is being destroyed this time. There are several reasons pointing to Manaea’s problem, beginning with the loss of 2.5 mph on his fastball over the last three seasons, from 93.8 mph (2023) to 91.3 mph in 2026. Another concerning point here is the loss of total vertical drop on his fastball, which has increased from 20.0” in 2023 to 22.2” this year. His Induced Vertical Break also dropped to the lowest point (10.7”) of his career since 2016 (10.5”), and this is causing his high fastballs to drop more than before and run the risk of staying in the strike zone or being more reachable by right-handed hitters. If there is something that has characterized Manaea throughout his career, it has been his ability to provide deep starts, but he has always been a pitcher prone to allowing home runs. That story has not changed this season. In nine of his last 12 outings, he has allowed at least one home run, despite completing five innings or more in 11 of them. The reality is that he has not worked in any role, and he has been part of another inefficient investment by the Mets. And the worst part is that they do not have much to do about it, beyond working to see if he can make the adjustments, perhaps finding another role for him on the pitching staff for next season or, most complicated of all, trying to get rid of his contract. With $25 million remaining for 2027, that will prove to be an entirely different problem. View full article
-
Sean Manaea’s Biggest Problem Is Now A Bigger Mets Problem
Yirsandy Rodríguez posted an article in Mets
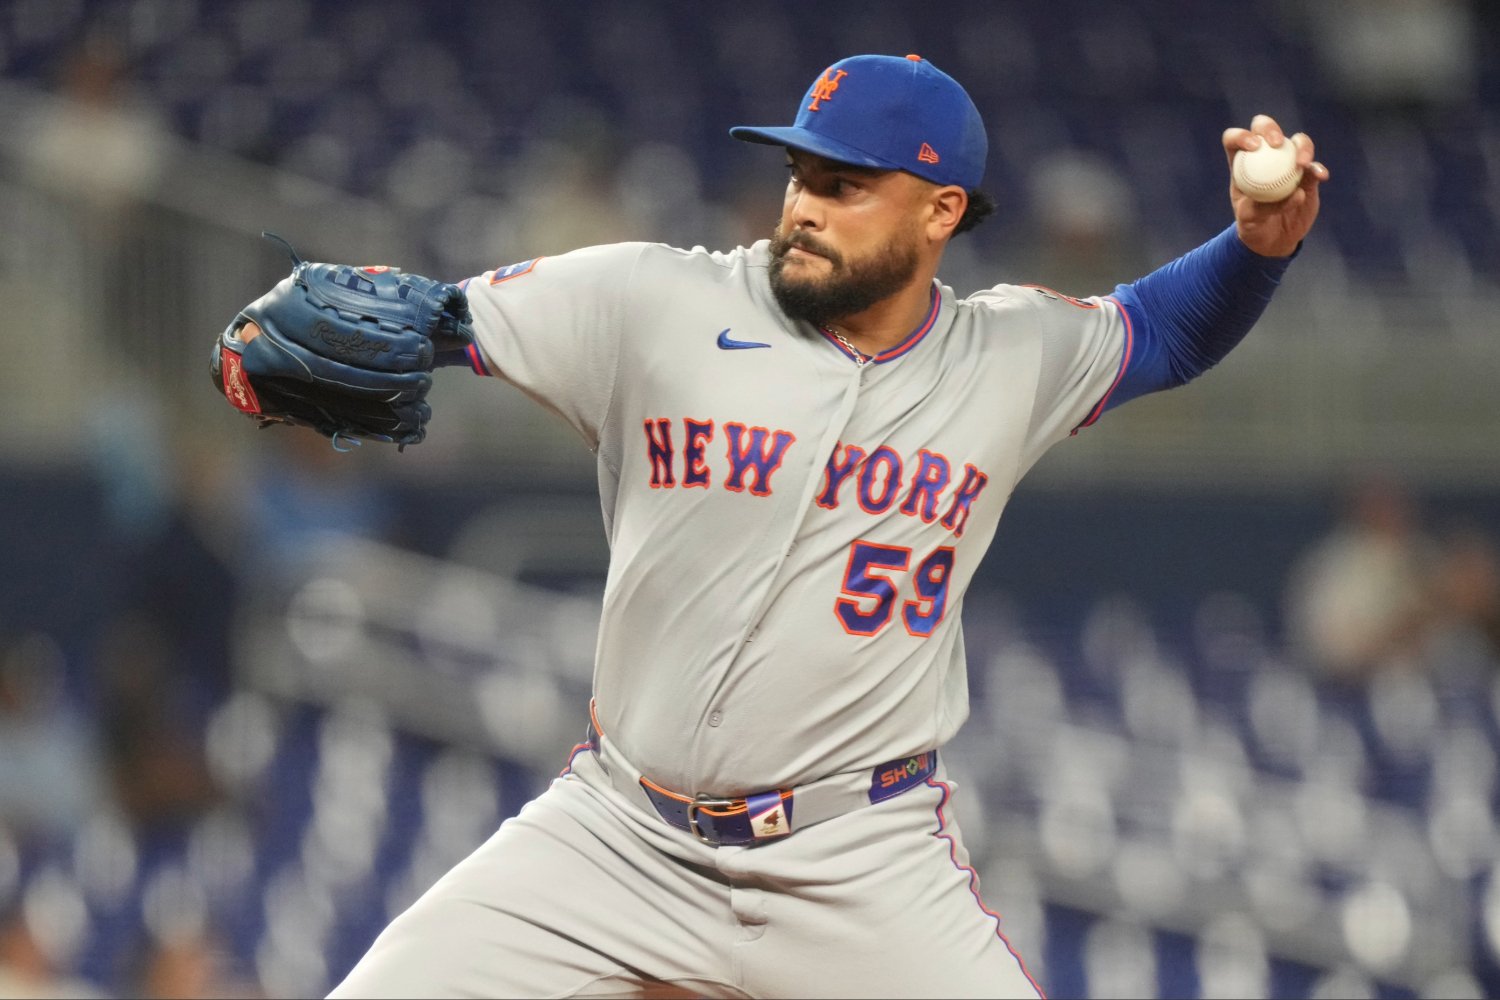 There is a problem that has chased Sean Manaea for almost his entire career, but it's reached a new level in his last two seasons: the inability to survive when he falls behind in the count. This season, Manaea has allowed the fourth-highest OPS+ (129) among qualified pitchers with at least 180 batters faced, only behind Spencer Arrighetti (151), Shota Imanaga (142), and Joey Cantillo (136). Against Manaea, the big difference has been marked by right-handed hitters. This season, he has posted the lowest K/BB rate (11.4) and the worst xFIP (4.93) against them. His ability to generate ground balls has also fallen from 51.4 GB% against lefties to 33.7% against righties, who are also managing to make contact with pitches outside the strike zone 16.7% more than lefties. Behind all these inconsistencies appears the most concerning point about the 34-year-old left-hander with 11 seasons: his four-seam fastball is not adding the value he needs to avoid depending so much on the sweeper. Manaea has allowed 21 home runs this season and 14 of them have come against his fastball. Opponents are slugging .472 against him, the second-highest mark of his entire career since the .503 he allowed in 2016. Manaea’s inability against right-handed hitters carries the most weight in the offensive disaster he has allowed in his last two seasons with the New York Mets. If we compare the span of these two most recent seasons with the two previous ones, 2023-2024 vs. 2025-2026, we can find several interesting trends. It is important to keep in mind the notable differences between the 2023 Manaea with the Giants and 2024 in his first season with the Mets, and then the one we have seen over these last two years, when he missed practically the first half of the 2025 season. 2023-2024: 19-12, 3.85 ERA, 3.86 FIP and 3.1 bWAR 2025-2026: 7-11, 5.06 ERA, 4.46 FIP and –0.3 bWAR According to Baseball Reference data, these last two seasons mark the first time in Manaea’s entire career with two consecutive seasons of negative WAR. FanGraphs gives him much more credit, placing him at 0.4 fWAR in 2025 and 0.8 in 2026. However, it is clear that this decline from Manaea puts him in the worst stretch of his career, two seasons after posting 2.8 fWAR in 2024, the second-highest of his career. That said, let’s now get into the big challenge that Manaea is failing to overcome. Here is an interesting summary of the offense in the two periods against right-handed hitters when he falls behind in the count. Period Pitch % PA K% HR% BA OBP SLG BABIP Hard Hit% Whiffs% 2023-2024 18.7% 282 12.8% 1.8% .235 .461 .393 .261 42.6% 21.7% 2025-2026 17.5% 172 9.3% 4.1% .354 .515 .622 .362 43.4% 15.8% There are major differences that are notable: the growth in Manaea’s home run rate, and how, with a hard-hit rate that has increased by just 0.8%, right-handers have unleashed more contact and power. The 5.9% decline in the whiff rate does not go unnoticed, but the result of the at-bat suggests a much more difficult problem to reverse. The two graphs on the left belong to the 2023-2024 stretch, and the other two to the most recent one. In the first, we can observe more dominance from Manaea in several of the zones where he recorded the highest percentage of pitches. The high pitches, inside and on the outside corner worked for him. Everything changed in the following stretch. That similar tendency to throw the fastball against right-handers at a high point outside the zone, well inside or far and outside, is being destroyed this time. There are several reasons pointing to Manaea’s problem, beginning with the loss of 2.5 mph on his fastball over the last three seasons, from 93.8 mph (2023) to 91.3 mph in 2026. Another concerning point here is the loss of total vertical drop on his fastball, which has increased from 20.0” in 2023 to 22.2” this year. His Induced Vertical Break also dropped to the lowest point (10.7”) of his career since 2016 (10.5”), and this is causing his high fastballs to drop more than before and run the risk of staying in the strike zone or being more reachable by right-handed hitters. If there is something that has characterized Manaea throughout his career, it has been his ability to provide deep starts, but he has always been a pitcher prone to allowing home runs. That story has not changed this season. In nine of his last 12 outings, he has allowed at least one home run, despite completing five innings or more in 11 of them. The reality is that he has not worked in any role, and he has been part of another inefficient investment by the Mets. And the worst part is that they do not have much to do about it, beyond working to see if he can make the adjustments, perhaps finding another role for him on the pitching staff for next season or, most complicated of all, trying to get rid of his contract. With $25 million remaining for 2027, that will prove to be an entirely different problem.
 -
MFS62 reacted to a post in a topic:
How Carson Benge’s Adjustments Have Put Him on the Verge of a Historic Mets Rookie Season
-
smg58 reacted to a post in a topic:
How Carson Benge’s Adjustments Have Put Him on the Verge of a Historic Mets Rookie Season
-
 Yirsandy Rodríguez reacted to a post in a topic:
How Carson Benge’s Adjustments Have Put Him on the Verge of a Historic Mets Rookie Season
Yirsandy Rodríguez reacted to a post in a topic:
How Carson Benge’s Adjustments Have Put Him on the Verge of a Historic Mets Rookie Season
-
Haha, now you’re making me nervous! 😂 I guess we’ll find out if writing about a hot streak really is bad luck.
-
Image courtesy of © Kim Klement Neitzel-Imagn Images His ability and talent to impact the game is something that has quickly turned Carson Benge into one of the most interesting young players in the entire league. He has stood out as a player with elite defensive and speed tools, standing out for the power and accuracy of his arm in the outfield (100th percentile in Arm Value and 99th in Arm Strength). His ability and explosiveness on the bases has taken him to the 92nd percentile. Offensively, Benge has displayed a brilliant ability to elevate the ball at the ideal angle (82nd percentile in LA Sweet Spot %), which supports an outstanding expected batting average (xBA) in the 89th percentile. No matter how high the expectations around a top prospect are before debuting, reaching Benge’s accumulated playing time and doing it with that impact constitutes a very difficult challenge for a rookie, especially in New York. Benge has done it since he debuted and is on his way to completing an unprecedented season in franchise history. Have you ever wondered how many rookie hitters 23 or younger have achieved a 20-20 season with the Mets? The answer is simple: no one has achieved it yet. It is likely that the name Darryl Strawberry came to your mind—it happened to me too. Strawberry, in his season at 21 years old when he won the Rookie of the Year Award in 1983, hit 26 home runs, but finished with 19 stolen bases. Player bWAR Place Season Age WAR G PA HR RBI SB BB SO BA OBP SLG OPS OPS+ Carson Benge 2.7 2026 23 2.7 137 566 16 54 20 40 123 .276 .334 .416 .750 109 Darryl Strawberry 2.6 ROY-1 1983 21 2.6 122 473 26 74 19 47 128 .257 .336 .512 .848 134 A.J. Ewing 2.6 2026 21 2.6 101 416 8 30 22 39 108 .242 .316 .359 .674 88 Lee Mazzilli 1.2 1977 22 1.2 159 618 6 46 22 72 72 .250 .340 .339 .679 88 Gregg Jefferies 0.7 ROY-3 1989 21 0.7 141 559 12 56 21 39 46 .258 .314 .392 .706 106 Benge could be the first 20-20 player in Mets history if he gets those four home runs he is missing. He leads the ranking so far in bWAR and has the highest batting average. I am also excited to see that A.J. Ewing also appears here, but his power has still not been able to make enough of an impact. I do not rule out the possibilities of Benge being able to achieve it, but his adjustments after June suggest that he has focused more on expanding his ability to make contact. In a way, that is even more interesting to me, since Benge has gotten this far with that philosophy and, even so, has had interesting flashes of power. Eleven of his 16 home runs came in the first half of the season, when he hit .263/.326/.402, with a 104 wRC+. That performance has taken a very interesting jump, as Benge has improved to .301/.350/.446 with a 120 wRC+ since the All-Star break. The major adjustment that changed the course of his season was when breaking balls stopped limiting his contact. It all began after June. Split Pitches PA HR K% BB% BA OBP SLG OPS BABIP Hard Hit% Apr - Jun vs Breakings 379 91 2 34.1% 3.3% .198 .242 .291 .533 .283 38.2% Jul - Sep/Oct. vs Breakings 263 62 2 22.6% 1.6% .233 .258 .417 .675 .273 43.5% Apr - Jun vs Fastballs 833 199 6 17.1% 9.5% .298 .372 .427 .799 .341 42.3% Jul - Sep/Oct. vs Fastballs 508 119 4 18.5% 11.8% .365 .445 .510 .955 .436 31.3% Benge reduced his strikeout rate by 11.5 percentage points, and by improving his contact, his slugging jumped from .291 to .417 against breaking balls. His Hard-Hit% rate also had an increase (up 5.3 points) and within the adjustment process, this led pitchers to stop throwing him so many breakers. Benge’s contact has improved against fastballs, with a jump from a .799 OPS to .955 from July to date, while his BABIP has reached its highest point (.436). In fact, if we considering his stats against any given pitch, Benge’s BABIP (.366) also stands out as the seventh-highest among all qualified left-handed hitters since July. Even this month, when Benge’s OPS has fallen to .586 — his second-lowest this year after the .525 in April — his BABIP (.313) still does not seem to have collapsed. Everything responds to the way he has managed to make adjustments and know what his job is. He has no holes against any profile: he has a 103 wRC+ and .340 BABIP against left-handed pitchers, and a 112 wRC+ with .331 BABIP against right-handers. He has gotten at least one hit in 94 of his 139 games, with 35 of them recording at least one hit and a walk. He has been a young force that has been able to exceed the expectations of his prospect profile and still continues to show that he can improve. Even if Benge does not make history as the first rookie 23 or younger with a 20-20 season, he has already become one of the players with the most influence on the future direction of the Mets. View full article
-
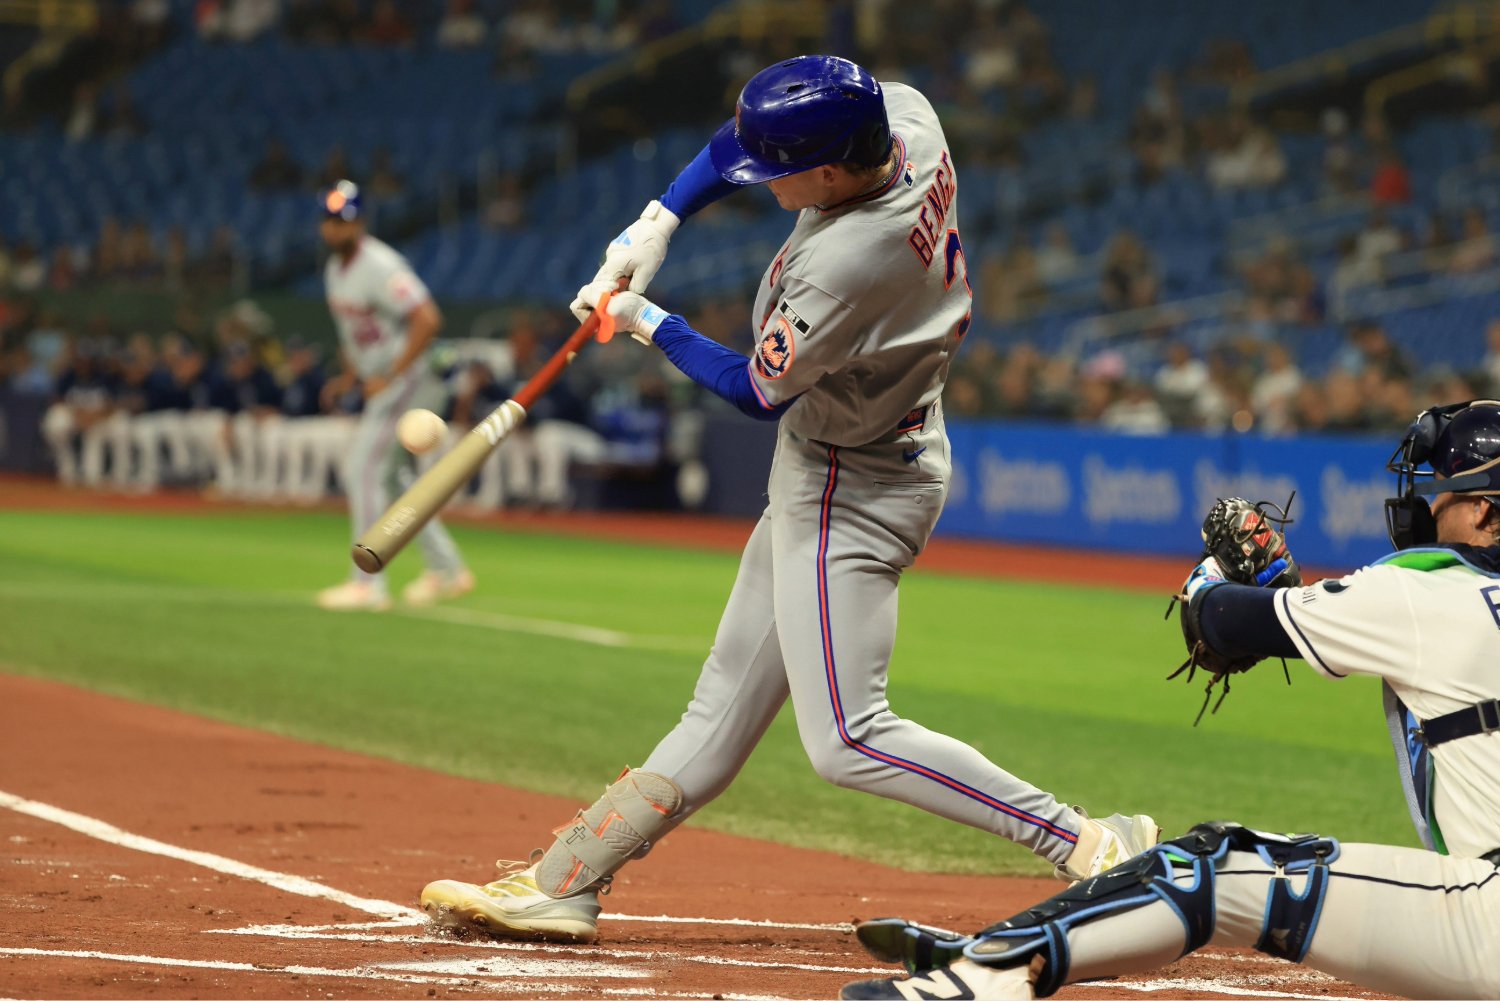 His ability and talent to impact the game is something that has quickly turned Carson Benge into one of the most interesting young players in the entire league. He has stood out as a player with elite defensive and speed tools, standing out for the power and accuracy of his arm in the outfield (100th percentile in Arm Value and 99th in Arm Strength). His ability and explosiveness on the bases has taken him to the 92nd percentile. Offensively, Benge has displayed a brilliant ability to elevate the ball at the ideal angle (82nd percentile in LA Sweet Spot %), which supports an outstanding expected batting average (xBA) in the 89th percentile. No matter how high the expectations around a top prospect are before debuting, reaching Benge’s accumulated playing time and doing it with that impact constitutes a very difficult challenge for a rookie, especially in New York. Benge has done it since he debuted and is on his way to completing an unprecedented season in franchise history. Have you ever wondered how many rookie hitters 23 or younger have achieved a 20-20 season with the Mets? The answer is simple: no one has achieved it yet. It is likely that the name Darryl Strawberry came to your mind—it happened to me too. Strawberry, in his season at 21 years old when he won the Rookie of the Year Award in 1983, hit 26 home runs, but finished with 19 stolen bases. Player bWAR Place Season Age WAR G PA HR RBI SB BB SO BA OBP SLG OPS OPS+ Carson Benge 2.7 2026 23 2.7 137 566 16 54 20 40 123 .276 .334 .416 .750 109 Darryl Strawberry 2.6 ROY-1 1983 21 2.6 122 473 26 74 19 47 128 .257 .336 .512 .848 134 A.J. Ewing 2.6 2026 21 2.6 101 416 8 30 22 39 108 .242 .316 .359 .674 88 Lee Mazzilli 1.2 1977 22 1.2 159 618 6 46 22 72 72 .250 .340 .339 .679 88 Gregg Jefferies 0.7 ROY-3 1989 21 0.7 141 559 12 56 21 39 46 .258 .314 .392 .706 106 Benge could be the first 20-20 player in Mets history if he gets those four home runs he is missing. He leads the ranking so far in bWAR and has the highest batting average. I am also excited to see that A.J. Ewing also appears here, but his power has still not been able to make enough of an impact. I do not rule out the possibilities of Benge being able to achieve it, but his adjustments after June suggest that he has focused more on expanding his ability to make contact. In a way, that is even more interesting to me, since Benge has gotten this far with that philosophy and, even so, has had interesting flashes of power. Eleven of his 16 home runs came in the first half of the season, when he hit .263/.326/.402, with a 104 wRC+. That performance has taken a very interesting jump, as Benge has improved to .301/.350/.446 with a 120 wRC+ since the All-Star break. The major adjustment that changed the course of his season was when breaking balls stopped limiting his contact. It all began after June. Split Pitches PA HR K% BB% BA OBP SLG OPS BABIP Hard Hit% Apr - Jun vs Breakings 379 91 2 34.1% 3.3% .198 .242 .291 .533 .283 38.2% Jul - Sep/Oct. vs Breakings 263 62 2 22.6% 1.6% .233 .258 .417 .675 .273 43.5% Apr - Jun vs Fastballs 833 199 6 17.1% 9.5% .298 .372 .427 .799 .341 42.3% Jul - Sep/Oct. vs Fastballs 508 119 4 18.5% 11.8% .365 .445 .510 .955 .436 31.3% Benge reduced his strikeout rate by 11.5 percentage points, and by improving his contact, his slugging jumped from .291 to .417 against breaking balls. His Hard-Hit% rate also had an increase (up 5.3 points) and within the adjustment process, this led pitchers to stop throwing him so many breakers. Benge’s contact has improved against fastballs, with a jump from a .799 OPS to .955 from July to date, while his BABIP has reached its highest point (.436). In fact, if we considering his stats against any given pitch, Benge’s BABIP (.366) also stands out as the seventh-highest among all qualified left-handed hitters since July. Even this month, when Benge’s OPS has fallen to .586 — his second-lowest this year after the .525 in April — his BABIP (.313) still does not seem to have collapsed. Everything responds to the way he has managed to make adjustments and know what his job is. He has no holes against any profile: he has a 103 wRC+ and .340 BABIP against left-handed pitchers, and a 112 wRC+ with .331 BABIP against right-handers. He has gotten at least one hit in 94 of his 139 games, with 35 of them recording at least one hit and a walk. He has been a young force that has been able to exceed the expectations of his prospect profile and still continues to show that he can improve. Even if Benge does not make history as the first rookie 23 or younger with a 20-20 season, he has already become one of the players with the most influence on the future direction of the Mets.
 -
smg58 reacted to a post in a topic:
Nate Lavender Is Giving the Mets Another Reason to Believe In the Future of Their Bullpen
-
MFS62 reacted to a post in a topic:
Marcus Semien's Total Offensive Collapse Is Owed To A Frustratingly Simple Explanation
-
Edgy MD reacted to a post in a topic:
Marcus Semien's Total Offensive Collapse Is Owed To A Frustratingly Simple Explanation
-
That’s a fair distinction. I agree that the trade was more about moving on from Nimmo’s contract than making Semien the next big Mets star. When I wrote “high expectations,” I was thinking more about the expectations attached to the production they were hoping to get from him compared with what he has actually provided. And I agree on the historical comparison. It’s much easier to make the offensive case because we have reliable metrics to compare across eras, while defensive value is much harder to evaluate historically. My point was mainly to put into context how unusual his current season has been, especially considering what he was doing in Texas.
-
Yirsandy Rodríguez reacted to a post in a topic:
Marcus Semien's Total Offensive Collapse Is Owed To A Frustratingly Simple Explanation
-
Absolutely. Núñez is a good example of why we have to be careful with a small sample from a reliever. That’s also why I’m not projecting Lavender’s current numbers forward. For me, the interesting part is that the Mets are already putting him in high-leverage spots and he has shown some traits that make the early results worth watching—especially the extension, fastball shape and the way his sweeper/changeup combination gives hitters two very different looks at similar velocity. Now he has to sustain it.
