


N.B. Lindberg
-
Posts
50 -
Joined
-
Last visited
N.B. Lindberg's Achievements


-
Francisco Lindor, Juan Soto Contracts Are Not To Blame For Mets' Woes
N.B. Lindberg posted an article in Mets
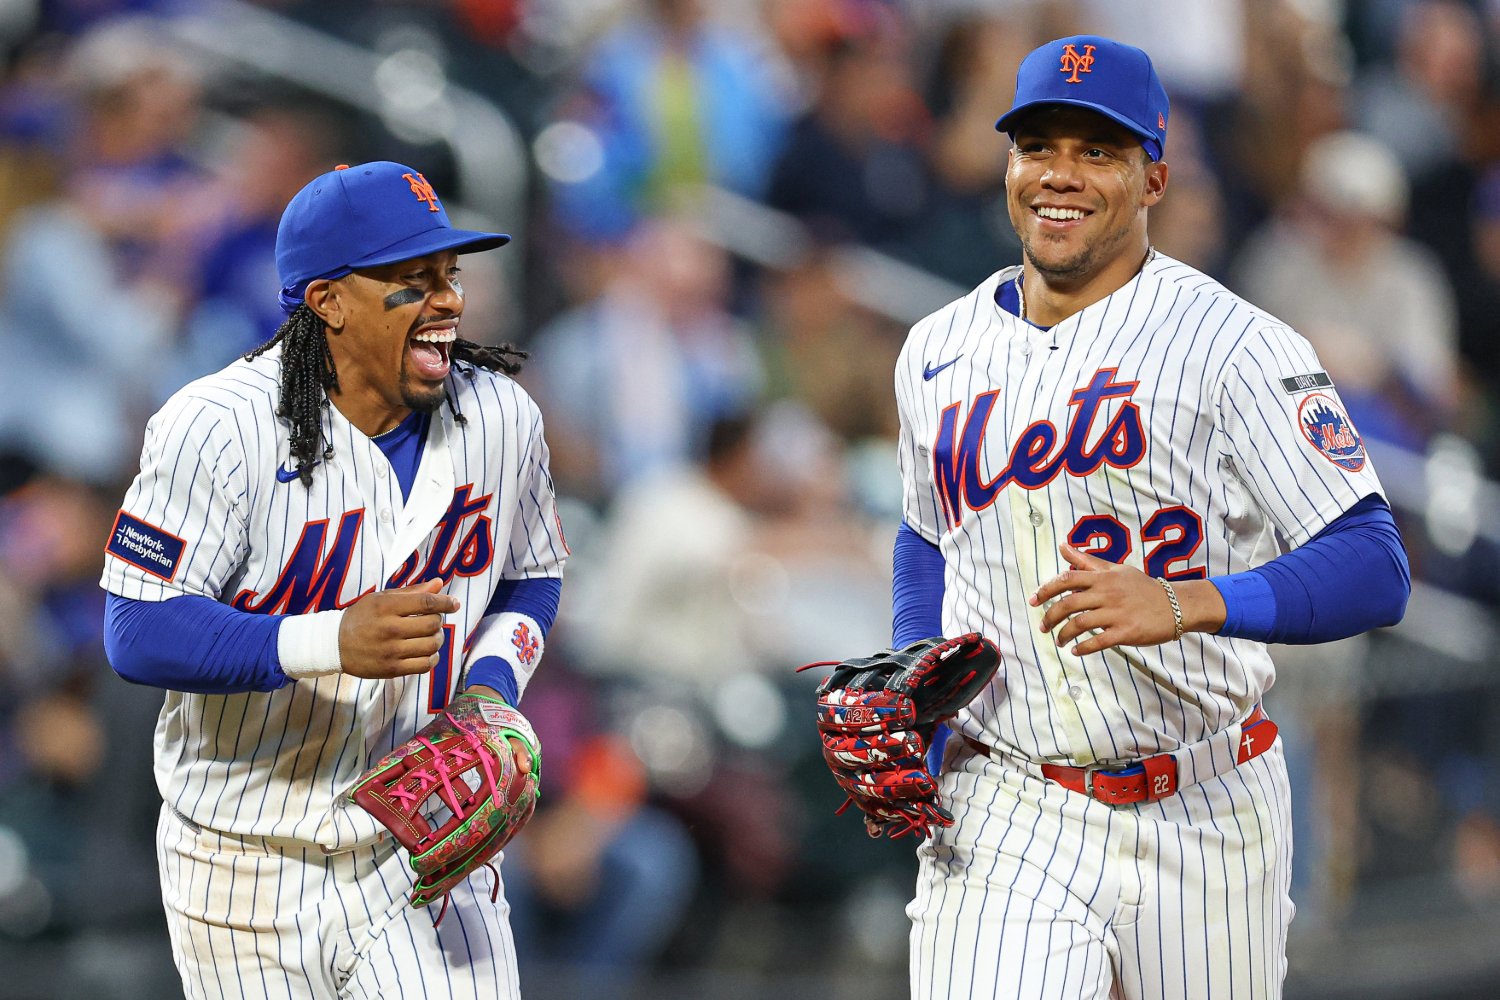 They say money can’t buy you happiness, love, friends, and, apparently, pennants. Outside of the Los Angeles Dodgers, who are back in the NLCS for the third consecutive season, the league’s most expensive teams either failed to make the postseason or have been eliminated prior to the championship series. Team Total Payroll Allocations Wins Cost per Win NYM $346,736,805 74 $4,685,633 LAD $339,319,244 100 $3,393,192 NYY $308,336,780 93 $3,315,449 PHI $291,951,676 88 $3,317,633 TOR $276,130,678 79 $3,495,325 ATL $263,462,438 94 $2,802,792 CHC $249,319,956 89 $2,801,348 HOU $239,763,783 81 $2,960,047 SD $226,252,714 91 $2,486,294 BOS $207,988,016 87 $2,390,667 DET $202,081,991 76 $2,658,974 ARI $192,670,027 86 $2,240,349 TEX $191,262,798 80 $2,390,785 SF $190,174,131 65 $2,925,756 LAA $182,509,023 62 $2,943,694 SEA $169,556,014 76 $2,231,000 BAL $167,039,211 79 $2,114,420 KC $150,429,892 69 $2,180,143 MIL $146,206,320 103 $1,419,479 CIN $128,223,748 75 $1,709,650 COL $121,526,750 58 $2,095,289 MIN $115,748,036 77 $1,503,221 PIT $106,728,501 82 $1,301,567 CHW $103,330,141 84 $1,230,121 WSH $101,639,888 77 $1,319,999 ATH $98,948,812 64 $1,546,075 STL $96,396,498 77 $1,251,903 TB $95,615,469 98 $975,668 MIA $83,298,123 80 $1,041,227 CLE $74,459,014 85 $875,988 While this isn’t the topic of this article, just know that if the owners lock the players out for a salary cap, it isn’t about competitive balance. The linear correlation between total payroll and wins in 2026 was 0.299, which is very weak. Now, none of this has stopped people from trolling the Mets, who, for the low, low price of $346 million, won 74 games. Their $4.685 million per win was by far the highest in the league, and the supposed culprits of this extreme inefficiency were none other than Juan Soto and Francisco Lindor. When a team this expensive fails this spectacularly, it’s easy to blame the highest earners, but that’s not exactly what went wrong with the 2026 Mets. That being said, Lindor and Soto aren’t blameless; the pair earned a combined $95.975 million and produced a measly 5.5 fWAR. However, that had far more to do with injury. If Soto and Lindor had hit 158 games played, instead of 111 and 105 respectively, they would have combined for 7.72 fWAR if they had played at their seasonal fWAR pace. When you throw Bo Bichette in the mix, who earned $42 million and produced 1.9 fWAR, things do get worse. All told, the Mets’ three highest earners took home $137.975 million in salary and produced 7.2 fWAR. Player Salary WAR G PA WAR/158G WAR/600PA WAR-Blend Juan Soto $61,875,000 3.1 111 482 4.41 3.86 4.14 Bo Bichette $42,000,000 1.9 160 696 1.88 1.64 1.76 Francisco Lindor $34,100,000 2.2 105 469 3.31 2.81 3.06 Totals $137,975,000 7.2 376 1647 9.60 8.31 8.96 Stars need to be stars, and the Mets’ three position-player stars fell short because of injury in Lindor and Soto’s case and underperformance in Bichette’s. But that’s not why the Mets won 74 games despite a $350 million payroll. What doomed the Mets was that their middle class of earners absolutely stunk. The Mets had six players who earned between $10 million and $20 million, for a total of $116.112 million in salary. That half-dozen cohort combined to produce an unfathomable -0.2 fWAR. Player Salary WAR Marcus Semien $26,000,000 -0.5 Sean Manaea $25,000,000 1.0 Luis Robert Jr. $17,112,299 0.5 Devin Williams $17,000,000 0.8 Jorge Polanco $17,000,000 -1.4 Kodai Senga $14,000,000 -0.6 Total $116,112,299 -0.2 Obviously, Jorge Polanco’s -1.4 fWAR looms large, but when Sean Manaea’s 1.0 fWAR leads the pack, this level of putridness is still a group effort. While the Mets’ three highest earners have received the most criticism, their average of $19.163 million per fWAR looks like a downright bargain compared to these laggards. If the Mets’ middle earners had produced at that allegedly reprehensible pace, they would have combined for an fWAR of 6.06. To put in perspective how much damage the dismal half-dozen caused, the Mets spent $32.68 million on players who didn’t play for them. Somehow, some way, that money led to more fWAR. If you combine that dead money with their vengeful zombie money, the Mets spent $148.8 million for -0.2 fWAR. Now, nothing we've discussed has been an efficient use of dollars, but it's clear that the Mets’ season didn’t end in disaster solely because Juan Soto and Francisco Lindor stunk. The main reason the Mets fell short of their financial expenditures is that their middle class collapsed, and their stars weren’t bright enough to offset it. On the bright-ish side, the Mets’ lower earners were actually relatively productive. Among players who earned between $1 million and $9.9 million, that group of 13 produced 10.6 fWAR for a total cost of $53.4 million. And the 21 players who took home less than $1 million racked up 13.8 fWAR for $13.5 million. Now, the pre-arbitration and arbitration system is specifically designed to churn out value production—hence the complete farce that a salary cap has much to do about competitive balance—but the Mets did solidly here, which portends a brighter future. Nolan McLean, Carson Benge, A.J. Ewing, and Christian Scott, who accounted for 11.9 of their sub-million 13.8 fWAR, won’t be cheap forever, but they will be cheap for the next three to four seasons. With continued growth, a bounce back from their stars, and hopefully a rebuilt middle class, the Mets can put their financial resources to good use, instead of burning a mountain of cash like they're the Joker in The Dark Knight.
 -
Image courtesy of Vincent Carchietta-Imagn Images They say money can’t buy you happiness, love, friends, and, apparently, pennants. Outside of the Los Angeles Dodgers, who are back in the NLCS for the third consecutive season, the league’s most expensive teams either failed to make the postseason or have been eliminated prior to the championship series. Team Total Payroll Allocations Wins Cost per Win NYM $346,736,805 74 $4,685,633 LAD $339,319,244 100 $3,393,192 NYY $308,336,780 93 $3,315,449 PHI $291,951,676 88 $3,317,633 TOR $276,130,678 79 $3,495,325 ATL $263,462,438 94 $2,802,792 CHC $249,319,956 89 $2,801,348 HOU $239,763,783 81 $2,960,047 SD $226,252,714 91 $2,486,294 BOS $207,988,016 87 $2,390,667 DET $202,081,991 76 $2,658,974 ARI $192,670,027 86 $2,240,349 TEX $191,262,798 80 $2,390,785 SF $190,174,131 65 $2,925,756 LAA $182,509,023 62 $2,943,694 SEA $169,556,014 76 $2,231,000 BAL $167,039,211 79 $2,114,420 KC $150,429,892 69 $2,180,143 MIL $146,206,320 103 $1,419,479 CIN $128,223,748 75 $1,709,650 COL $121,526,750 58 $2,095,289 MIN $115,748,036 77 $1,503,221 PIT $106,728,501 82 $1,301,567 CHW $103,330,141 84 $1,230,121 WSH $101,639,888 77 $1,319,999 ATH $98,948,812 64 $1,546,075 STL $96,396,498 77 $1,251,903 TB $95,615,469 98 $975,668 MIA $83,298,123 80 $1,041,227 CLE $74,459,014 85 $875,988 While this isn’t the topic of this article, just know that if the owners lock the players out for a salary cap, it isn’t about competitive balance. The linear correlation between total payroll and wins in 2026 was 0.299, which is very weak. Now, none of this has stopped people from trolling the Mets, who, for the low, low price of $346 million, won 74 games. Their $4.685 million per win was by far the highest in the league, and the supposed culprits of this extreme inefficiency were none other than Juan Soto and Francisco Lindor. When a team this expensive fails this spectacularly, it’s easy to blame the highest earners, but that’s not exactly what went wrong with the 2026 Mets. That being said, Lindor and Soto aren’t blameless; the pair earned a combined $95.975 million and produced a measly 5.5 fWAR. However, that had far more to do with injury. If Soto and Lindor had hit 158 games played, instead of 111 and 105 respectively, they would have combined for 7.72 fWAR if they had played at their seasonal fWAR pace. When you throw Bo Bichette in the mix, who earned $42 million and produced 1.9 fWAR, things do get worse. All told, the Mets’ three highest earners took home $137.975 million in salary and produced 7.2 fWAR. Player Salary WAR G PA WAR/158G WAR/600PA WAR-Blend Juan Soto $61,875,000 3.1 111 482 4.41 3.86 4.14 Bo Bichette $42,000,000 1.9 160 696 1.88 1.64 1.76 Francisco Lindor $34,100,000 2.2 105 469 3.31 2.81 3.06 Totals $137,975,000 7.2 376 1647 9.60 8.31 8.96 Stars need to be stars, and the Mets’ three position-player stars fell short because of injury in Lindor and Soto’s case and underperformance in Bichette’s. But that’s not why the Mets won 74 games despite a $350 million payroll. What doomed the Mets was that their middle class of earners absolutely stunk. The Mets had six players who earned between $10 million and $20 million, for a total of $116.112 million in salary. That half-dozen cohort combined to produce an unfathomable -0.2 fWAR. Player Salary WAR Marcus Semien $26,000,000 -0.5 Sean Manaea $25,000,000 1.0 Luis Robert Jr. $17,112,299 0.5 Devin Williams $17,000,000 0.8 Jorge Polanco $17,000,000 -1.4 Kodai Senga $14,000,000 -0.6 Total $116,112,299 -0.2 Obviously, Jorge Polanco’s -1.4 fWAR looms large, but when Sean Manaea’s 1.0 fWAR leads the pack, this level of putridness is still a group effort. While the Mets’ three highest earners have received the most criticism, their average of $19.163 million per fWAR looks like a downright bargain compared to these laggards. If the Mets’ middle earners had produced at that allegedly reprehensible pace, they would have combined for an fWAR of 6.06. To put in perspective how much damage the dismal half-dozen caused, the Mets spent $32.68 million on players who didn’t play for them. Somehow, some way, that money led to more fWAR. If you combine that dead money with their vengeful zombie money, the Mets spent $148.8 million for -0.2 fWAR. Now, nothing we've discussed has been an efficient use of dollars, but it's clear that the Mets’ season didn’t end in disaster solely because Juan Soto and Francisco Lindor stunk. The main reason the Mets fell short of their financial expenditures is that their middle class collapsed, and their stars weren’t bright enough to offset it. On the bright-ish side, the Mets’ lower earners were actually relatively productive. Among players who earned between $1 million and $9.9 million, that group of 13 produced 10.6 fWAR for a total cost of $53.4 million. And the 21 players who took home less than $1 million racked up 13.8 fWAR for $13.5 million. Now, the pre-arbitration and arbitration system is specifically designed to churn out value production—hence the complete farce that a salary cap has much to do about competitive balance—but the Mets did solidly here, which portends a brighter future. Nolan McLean, Carson Benge, A.J. Ewing, and Christian Scott, who accounted for 11.9 of their sub-million 13.8 fWAR, won’t be cheap forever, but they will be cheap for the next three to four seasons. With continued growth, a bounce back from their stars, and hopefully a rebuilt middle class, the Mets can put their financial resources to good use, instead of burning a mountain of cash like they're the Joker in The Dark Knight. View full article
-
Image courtesy of Wendell Cruz-Imagn Images It’s usually not a good sign when your fans start actively cheering an opposing player, but that’s exactly where the 2026 New York Mets find themselves. Upon his return to Citi Field, the warm welcome Pete Alonso received is par for the course. If NBA teams will produce a "welcome back" montage for George Hill, then Alonso—who for seven seasons was at the heart of the Mets’ lineup, hit a franchise record 264 home runs, and slugged the to the 2024 National League Championship series—deserved a feature-length film. The thing is, Mets fans didn’t stop at a nice little ovation during his first plate appearance. They hoisted signs fit for Beatle-mania, booed when he was walked, and cheered so hard following a game-tying home run in the ninth inning that he, a visiting player, was granted a curtain call. But underneath the surface of this well-deserved love fest, another side came out. Alonso, who departed last fall in free agency, has come to embody fan resentment towards Mets’ President of Baseball Operations David Stearns. David Stearns was always walking into a difficult situation when he took over the Mets in the fall of 2023. His work in Milwaukee, where he built a perennial playoff machine with limited financial resources, gave him an aura of invincibility, and Mets owner Steve Cohen’s insistence on spending aggressively to chase a World Series raised expectations to a point where failure was always the most likely outcome. While not saving the Polar Bear has become the avatar of fan angst towards Stearns, the original sin was Cohen’s brash, unapologetic stance toward spending. Payroll is a superpower in baseball, but it isn’t a panacea. And while Cohen has spared no expense on the roster since taking over in 2020, it created an urgency for success that was antithetical to Stearns’ work in Milwaukee. In theory, bringing an executive so skilled at squeezing the most out of modest budgets and a firehouse of finances together seemed like a match made in heaven. But in practice, it’s a bit of oil and water. This isn’t to absolve Stearns of his work, but it is important context. He made his mark by creating an organizational infrastructure capable of continuously spitting out competent major league talent, which Milwaukee is still benefitting from, and then he was thrust into a win-now situation. As they say, Rome wasn’t built in a day, but after three seasons, it’s fair to ask: has Stearns laid the groundwork for the behemoth Mets fans were promised, or will the barbarians sack the city? B.S. (Before Stearns): 2023 Front offices are never granted a clean slate. Whatever messes the previous regime made, they have to clean up or wait out. The 2023 Mets followed up a 101-win campaign with a 75-87 stinker. They had the third-oldest average position player age (28.9) and the oldest pitcher age (31.9) in the National League. Simply put, Stearns inherited a morbidly expensive, geriatric roster that would need time to fully be flushed out. To make matters worse, the Mets’ signings of Justin Verlander and Max Scherzer to massive short-term deals followed them into 2024. In an effort to land better prospects when pulling the plug on 2023, the Mets paid down a combined $59.16 million of the pair’s 2024 salary. Upon taking the job, Stearns was saddled with an old, expensive roster, with some of its financial might tied behind its back, not to mention a mediocre minor-league system. It was far from an impossible situation, but the internal evaluation was almost certainly to tread water at the major-league level while the developmental infrastructure was built out. 2024: The Year Everything Went Right Look, sometimes a plan goes horribly right. The Mets called 2024 a bridge year and acted like it. Their offseason saw them sign 12 veteran free agents ostensibly to one-year deals, plus a host more to minor-league contracts. The lone exception to the one-year pact plan was Sean Manaea’s two-year deal, but even then the second year was a player option. Stocking up on bulk arms (Manaea, Luis Severino), middle relievers (Jake Diekman, Adam Ottavino, Jorge Lopez), and veteran stop-gaps (Harrison Bader, J.D. Martinez) isn’t particularly exciting, but they’ll keep the lights on and the powder dry. It shouldn’t be glossed over that the 2023-24 free agent class had Shohei Ohtani and Yoshinobu Yamamoto, which raises the question why the Mets weren’t more aggressive in their pursuit of true difference makers. Well, unfortunately, the Dodgers exist. They too have incredible financial resources, were coming off a 100-win season, and are geographically over 2,500 miles closer to Japan. The Mets were probably never seriously considered by either. That being said, the rest of the 2023-24 free agent class was pretty good. Excluding Aaron Nola, the Mets could have targeted Cody Bellinger, Sony Gray, Blake Snell, Matt Chapman, Shota Imanaga, Seth Lugo, Josh Hader, and Jung Hoo Lee. All of them came with their own question marks, but they either signed for short-term deals or had annual average values under $20 million. Unfortunately, the Mets’ lack of free agent fireworks didn’t doom them to a gap year. After a 22-33 start and a players only meeting, the Mets closed the season on a 67-40 run. They made the playoffs and then knocked off the Brewers and Phillies to make it to the NL Championship series where they would eventually lose to the Dodgers. For a gap year, it was perfect, but not entirely. The Mets were clearly, obviously in the early stages of reorienting their roster towards the future, and 2024 made them look like they were on the doorstep of a title. However, they still had the second oldest average position player (30.0) and pitcher age (31.0) in the National League and benefitted from some pretty unsustainable fortune. Three of their five starting pitchers made 30-plus starts, the four who hit 20-plus starts all had ERAs that beat their FIPs, and they got a 3.0 WAR season from Jose Iglesias, who had signed a minor-league deal to bolster their depth. The problem with lightning in a bottle is it doesn’t stay there. 2025: The Start of the Collapse The Mets entered 2025 as real contenders. They were coming off a fantastic run, returned a large chunk of the roster, added some guy named Juan Soto, and then got off to a fantastic start. On June 12, the Mets were 45-25, and looked poised to challenge the Dodgers for National League supremacy. Unfortunately, the wheels completely fell off from that moment on. They limped to a 38-56 finish, and missed the playoffs due to a tie breaker with the Cincinnati Reds. The reason for their complete and utter capitulation is as varied as it is mysterious, but a lot of it came down to bad luck. They had the run differential of an 86-76 team, and finished the season with the sixth-best position player WAR (28.1), tenth-best pitcher WAR (17.1), and fifth-best overall WAR (45.2), according to Fangraphs. Wins above replacement (WAR) has a very strong correlation to wins, hence the name, and the Mets underperformed their underlying production by a massive margin. Among teams with 40+ total team WAR, the lowest win total, excluding the Mets, were the Red Sox’s 89. Using a linear forecast model, the Mets underperformed their expected win total, based on WAR, by -8.6, the second largest underperformance in the league. Simply put, the front office built a very strong team that got ravaged by the baseball gods. Biggest WAR Underperformers 2025 Rk Team WAR (Pitch) WAR (Position) Total WAR Wins WAR Forecast Wins Forecast Wins - Wins 1 MIN 15.5 16.2 31.7 70 79.54 -9.54 2 NYM 17.1 28.1 45.2 83 91.60 -8.60 3 CHW 10.6 6.5 17.1 60 66.49 -6.49 4 COL 0.4 -3.1 -2.7 43 48.80 -5.80 5 ARI 9.5 27.2 36.7 80 84.01 -4.01 6 ATL 11.7 19.7 31.4 76 79.27 -3.27 7 PIT 19.4 5.7 25.1 71 73.64 -2.64 8 NYY 16.7 33.5 50.2 94 96.07 -2.07 9 LAD 20.2 28.8 49 93 95.00 -2.00 10 BOS 18.1 26.3 44.4 89 90.89 -1.89 A common refrain you’ll hear fans say when a team underperforms their underlying metrics is you can’t build a team in a spreadsheet. To that I say, “You only say that when things go wrong.” Every MLB team is built using statistics. Sometimes things go wrong, sometimes things go right, but baseball is an exceedingly random sport played on the finest of margins. The 2025 Mets were just a casualty of uncertainty, but 2026 has been a whole different ballgame. 2026: The Year Everything Went Wrong Giving the front office a mulligan for 2025 would be appropriate. The team was legitimately good, and in most worlds they coast to the playoffs. Unfortunately, the 2026 team has actually been awful, and few of Stearns' offseason moves have worked out. The signing of Bo Bichette has been an unmitigated disaster, Marcus Semien looks as cooked as burnt toast, and Pete Alonso has been exceptional in Baltimore. These three decisions have completely colored Stearns' tenure, but it’s probably not fair to say they were all bad ideas. First and foremost, Bichette’s struggles came completely out of nowhere. He has a career wRC+ of 118, was coming off a season with a wRC+ of 134, and was entering his age-28 season. Every team, finances permitting, would have signed him to that exact same three-year, $126 million deal the Mets did. His second-half wRC+ of 110 offers hope that should he exercise his player option the Mets will have the player they thought they signed. Trading Brandon Nimmo for Semien, and subsequently offloading Jeff McNeil, was about cleaning up the present and future of their finances while offering an opening for their young outfielders. Player Age (2026) 2026 2027 2028 2029 2030 Marcus Semien 35 $26,000,000 $26,000,000 $20,000,000 Brandon Nimmo 33 $20,500,000 $20,500,000 $20,500,000 $20,500,000 $20,500,000 Jeff McNeil 34 $15,750,000 $2,000,00 (Buy Out) With Nimmo out of the way, the Mets were able to promote Carson Benge—more on him later—and it also opened an avenue for A.J. Ewing in center. The hope that Semien still had something in the tank was a real risk, but his deal will be much more palatable to move or eat than Nimmo’s would have been. Unfortunately, letting Pete Alonso walk and replacing him with Jorge Polanco and the hope that Mark Vientos would stop being Mark Vientos has been an actual disaster. Committing $155 million to a first base, bat-only slugger entering their age-31 season is scary. The list of generationally awful contracts that have gone to players in that mold is a who’s who of regret: Albert Pujols, Miguel Cabrera, Chris Davis, and Ryan Howard, to name a few. On its face, Stearns decision is defensible, but the way it has played out has been about as bad as possible. Alonso has been fantastic this season, Polanco has either been injured and/or awful, and Vientos’ fantastic 2024 is looking like a total fluke. By the end of Alonso’s deal, Stearns will probably look vindicated, because he didn’t balk at $31 million in 2026, he balked at $31 million in 2030, but he’ll have to make it that far. Over Stearns' first three seasons at the helm, the on-field product has actually been solid. The problem is the implied trajectory. Going from 89 to 83 to 69 (and counting) wins does not inspire confidence that he is improving the team. Of course, that fails to acknowledge that MLB organizations are about more than the big-league club. The Hidden Rebuild Stearns was fundamentally brought in to rebuild the Mets. The hope was he could overhaul the Mets’ amateur scouting and development systems, while the big-league club stayed competitive, but he faced two serious challenges. The first was that the team he inherited was incredibly old, and the second was that the Mets' top prospects from the previous regime have largely faltered. Stearns has done an excellent job bringing the average age of the roster down. They were one of the oldest teams in the National League his first two seasons, but currently rank eighth in average position player age and fifth in average pitcher age. Considering the moves made at the deadline, there’s a good chance the team is even younger in 2027, and if it isn’t, that means veteran reinforcements. Season 2023 2024 2025 2026 Ave Pitcher Age 31.9 31 30.7 30.2 Ave Position Age 28.9 30 28.9 27.7 The youth movement might be underway, but the stagnation of Brett Baty and Francisco Alvarez has set the Mets back substantially in the short term. When Stearns took over in the fall of 2023, Baty was entering his age-25 season and Alvarez his age-23 campaign. They were supposed to be the heirs to the rapidly aging core, but both have struggled to make an impact. Since 2024, Alvarez has produced a total of 3.0 bWAR, at an average of 1.7 bWAR per 162 games, while Baty comes in at 4.3 for an average of 2.2 per 162 games. However, 3.0 of Baty’s bWAR came in 2025 alone, which means he’s been basically a replacement level player in two of the past three seasons. The truth is most prospects, even top ones, don’t become MVPs and All-Stars, but Baty at one point had a 55 grade and Alvarez a 60. Their current production, in particular Alvarez’s, is running well short of those grades, and it temporarily collapsed the Mets’ bridge to the future. This context is important because Stearns first draft was in 2024, which means few of his front office’s hand-picked players have had enough time to reach the bigs, except for one. The first pick Stearns made as the head of the Mets was Carson Benge, which seems to be working out pretty well. Time will tell about his other picks, but he has been able to build up the Mets’ farm system, without access to top tier draft picks. Farm System Overview Draft Picks Season Overall Rank Farm Value (in millions) Top-30 Picks Top-50 Picks Top-75 Picks Top-100 Picks Top-150 Picks 2023 6 $280 0 1 2 3 7 2024 16 $178 1 2 2 3 5 2025 7 $242 0 1 1 1 3 2026 6 $492 1 1 1 2 3 *Fangraphs organizational prospect rankings and value. In 2026 they changed their prospect valuation model The Mets have had a grand total of 11 picks within the top 150 since 2024, but have still managed to build and maintain a top-10 farm system. Part of that is down to the players he inherited, but they have done well in the international market, trades, and improved internal development. Stearns might not have drafted Nolan McLean, but he went from a third-round pick to the top pitching prospect under his watch. All told, Stearns has brought in six of the Mets current top-10 prospects, and dramatically improved the stock of countless pitchers already in the organization. So, while the big-league club has underperformed, the rest of the organization looks far healthier. The Blueprint and Finances However, the real question probably isn’t: Does David Stearns deserve to keep his job? The question is: What was his job? If Stearns was brought in to try and win a championship right away, then he’s failed. However, if his job was to build the infrastructure to consistently churn out major-league talent, then everything appears to be on track. That’s probably not a satisfying answer, but it’s the exact blueprint the Dodgers used to become the best team in baseball. They lost their cheap-o owners, brought in an Ivy league wiz to build an exceptional baseball development infrastructure, and then weaponized their financial resources to push them over the top. It’s easy to forget due to their decade-long run of dominance, but it took the Dodgers eight seasons to finally win a World Series. And while they were a perennial playoff team from the jump, they did have one sizable advantage over the Stearns-era Mets: money. When the Dodgers sold to Guggenheim Baseball Management in 2012, they had a payroll of $116.7 million, the ninth-highest in baseball, and over $100 million short of the Yankees' league-leading figure of $225.6 million. By 2013 (that’s one offseason for those that are counting) the Dodgers led baseball in payroll at $236.7 million. For as much as Cohen has talked about spending, and he has, Stearns never had the financial runway to completely remake the Mets' roster through cash. Season Total Salary RK 2023 $347,949,991 1 2024 $322,960,494 1 2025 $342,303,011 2 2026 $344,556,436 2 Truthfully, any team with a $300 million payroll should always be a playoff quality team, which makes 2026 such a disappointing, near-inexcusable season. But Stearns has positioned the Mets to have a ton of resources to quickly rebuild the squad for 202, assuming MLB doesn’t get their wish with a salary cap. Right now, the Mets have $267.7 million in guaranteed salary for 2027, which gives them over $70 million to add to the roster, should they maintain their current spending levels. The 2026-27 free agent class gets pretty thin after Tarik Skubal, but it is heavy on quality veteran arms. On top of that, the Mets’ long-term salary situation is pretty rosy. The only guaranteed contracts on their books for 2029 are Juan Soto and Francisco Lindor, two future Hall of Famers. While this doesn’t include any of their young core, they’ll all still be going through the arbitration process, meaning the Mets will be serious players to add high-end talent for the rest of the decade. Contrast that with the Dodgers, who have $238.5 million committed to seven players who will all be well into their 30s in 2029. While I completely understand the current fan sentiment towards David Stearns, it conveniently ignores all of the good he has done. The organization is in a much healthier place than when he took over. Their MiLB affiliates and development pipeline looks far better and their books are relatively clean going forward. Sure, he let Pete Alonso walk in free agency, but Alonso’s production wouldn’t have turned this team into a playoff team. Every front office makes mistakes. Stearns has made his. But he finally has the Mets looking like a sleeping giant ready to wake. View full article
-
Full Analysis of David Stearns' Tenure Proves Mets Were Right To Hire Him
N.B. Lindberg posted an article in Mets
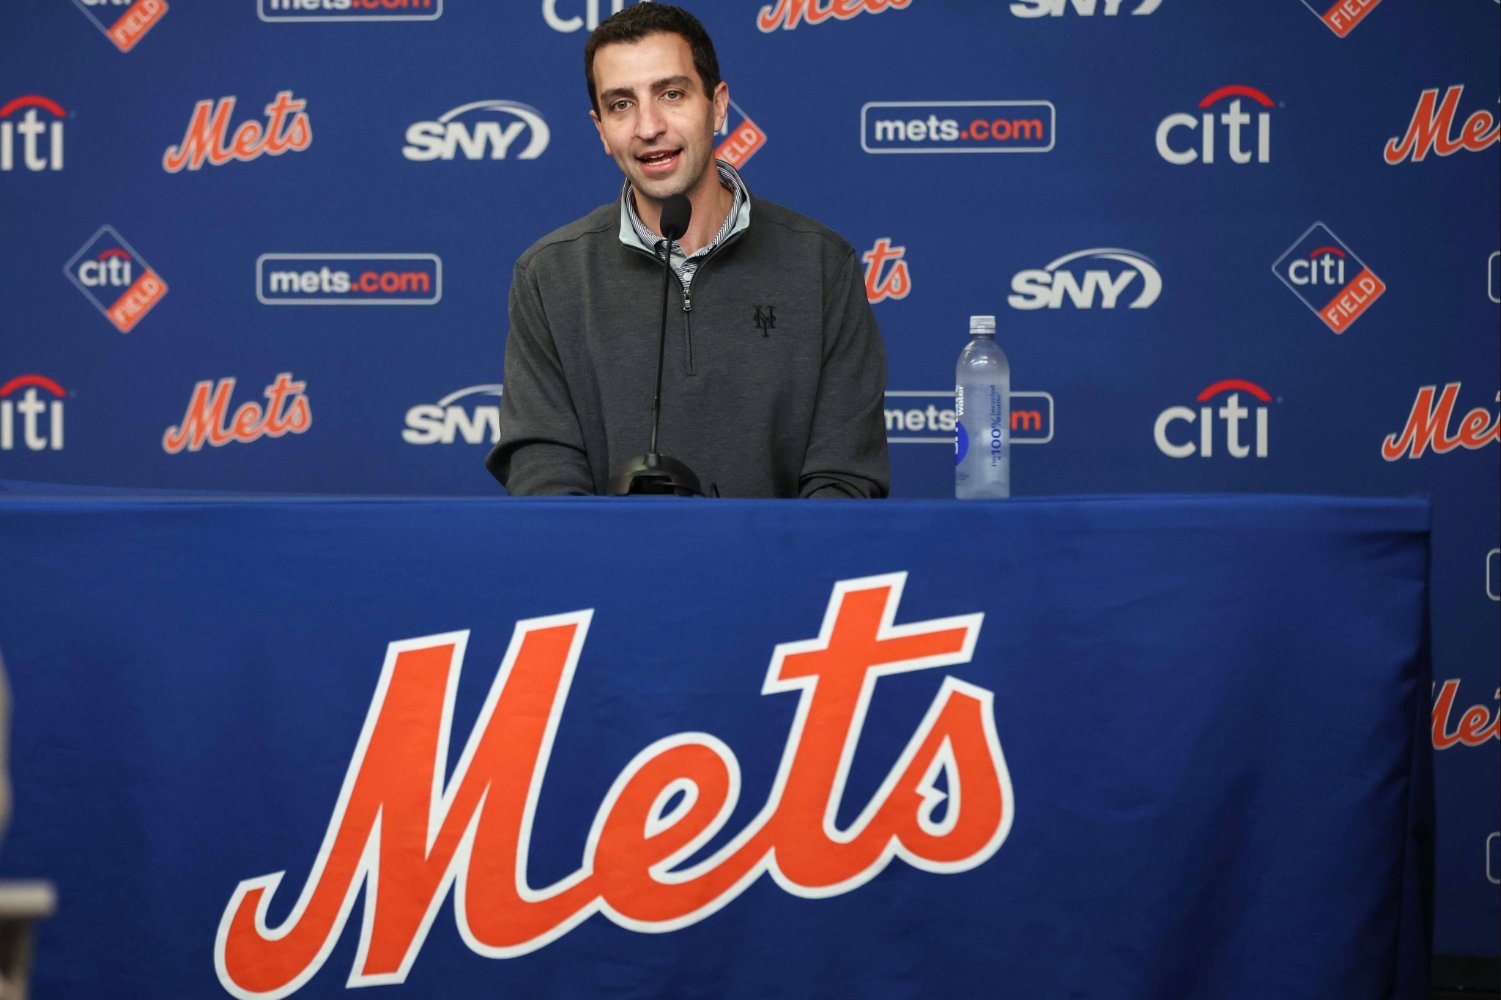 It’s usually not a good sign when your fans start actively cheering an opposing player, but that’s exactly where the 2026 New York Mets find themselves. Upon his return to Citi Field, the warm welcome Pete Alonso received is par for the course. If NBA teams will produce a "welcome back" montage for George Hill, then Alonso—who for seven seasons was at the heart of the Mets’ lineup, hit a franchise record 264 home runs, and slugged the to the 2024 National League Championship series—deserved a feature-length film. The thing is, Mets fans didn’t stop at a nice little ovation during his first plate appearance. They hoisted signs fit for Beatle-mania, booed when he was walked, and cheered so hard following a game-tying home run in the ninth inning that he, a visiting player, was granted a curtain call. But underneath the surface of this well-deserved love fest, another side came out. Alonso, who departed last fall in free agency, has come to embody fan resentment towards Mets’ President of Baseball Operations David Stearns. David Stearns was always walking into a difficult situation when he took over the Mets in the fall of 2023. His work in Milwaukee, where he built a perennial playoff machine with limited financial resources, gave him an aura of invincibility, and Mets owner Steve Cohen’s insistence on spending aggressively to chase a World Series raised expectations to a point where failure was always the most likely outcome. While not saving the Polar Bear has become the avatar of fan angst towards Stearns, the original sin was Cohen’s brash, unapologetic stance toward spending. Payroll is a superpower in baseball, but it isn’t a panacea. And while Cohen has spared no expense on the roster since taking over in 2020, it created an urgency for success that was antithetical to Stearns’ work in Milwaukee. In theory, bringing an executive so skilled at squeezing the most out of modest budgets and a firehouse of finances together seemed like a match made in heaven. But in practice, it’s a bit of oil and water. This isn’t to absolve Stearns of his work, but it is important context. He made his mark by creating an organizational infrastructure capable of continuously spitting out competent major league talent, which Milwaukee is still benefitting from, and then he was thrust into a win-now situation. As they say, Rome wasn’t built in a day, but after three seasons, it’s fair to ask: has Stearns laid the groundwork for the behemoth Mets fans were promised, or will the barbarians sack the city? B.S. (Before Stearns): 2023 Front offices are never granted a clean slate. Whatever messes the previous regime made, they have to clean up or wait out. The 2023 Mets followed up a 101-win campaign with a 75-87 stinker. They had the third-oldest average position player age (28.9) and the oldest pitcher age (31.9) in the National League. Simply put, Stearns inherited a morbidly expensive, geriatric roster that would need time to fully be flushed out. To make matters worse, the Mets’ signings of Justin Verlander and Max Scherzer to massive short-term deals followed them into 2024. In an effort to land better prospects when pulling the plug on 2023, the Mets paid down a combined $59.16 million of the pair’s 2024 salary. Upon taking the job, Stearns was saddled with an old, expensive roster, with some of its financial might tied behind its back, not to mention a mediocre minor-league system. It was far from an impossible situation, but the internal evaluation was almost certainly to tread water at the major-league level while the developmental infrastructure was built out. 2024: The Year Everything Went Right Look, sometimes a plan goes horribly right. The Mets called 2024 a bridge year and acted like it. Their offseason saw them sign 12 veteran free agents ostensibly to one-year deals, plus a host more to minor-league contracts. The lone exception to the one-year pact plan was Sean Manaea’s two-year deal, but even then the second year was a player option. Stocking up on bulk arms (Manaea, Luis Severino), middle relievers (Jake Diekman, Adam Ottavino, Jorge Lopez), and veteran stop-gaps (Harrison Bader, J.D. Martinez) isn’t particularly exciting, but they’ll keep the lights on and the powder dry. It shouldn’t be glossed over that the 2023-24 free agent class had Shohei Ohtani and Yoshinobu Yamamoto, which raises the question why the Mets weren’t more aggressive in their pursuit of true difference makers. Well, unfortunately, the Dodgers exist. They too have incredible financial resources, were coming off a 100-win season, and are geographically over 2,500 miles closer to Japan. The Mets were probably never seriously considered by either. That being said, the rest of the 2023-24 free agent class was pretty good. Excluding Aaron Nola, the Mets could have targeted Cody Bellinger, Sony Gray, Blake Snell, Matt Chapman, Shota Imanaga, Seth Lugo, Josh Hader, and Jung Hoo Lee. All of them came with their own question marks, but they either signed for short-term deals or had annual average values under $20 million. Unfortunately, the Mets’ lack of free agent fireworks didn’t doom them to a gap year. After a 22-33 start and a players only meeting, the Mets closed the season on a 67-40 run. They made the playoffs and then knocked off the Brewers and Phillies to make it to the NL Championship series where they would eventually lose to the Dodgers. For a gap year, it was perfect, but not entirely. The Mets were clearly, obviously in the early stages of reorienting their roster towards the future, and 2024 made them look like they were on the doorstep of a title. However, they still had the second oldest average position player (30.0) and pitcher age (31.0) in the National League and benefitted from some pretty unsustainable fortune. Three of their five starting pitchers made 30-plus starts, the four who hit 20-plus starts all had ERAs that beat their FIPs, and they got a 3.0 WAR season from Jose Iglesias, who had signed a minor-league deal to bolster their depth. The problem with lightning in a bottle is it doesn’t stay there. 2025: The Start of the Collapse The Mets entered 2025 as real contenders. They were coming off a fantastic run, returned a large chunk of the roster, added some guy named Juan Soto, and then got off to a fantastic start. On June 12, the Mets were 45-25, and looked poised to challenge the Dodgers for National League supremacy. Unfortunately, the wheels completely fell off from that moment on. They limped to a 38-56 finish, and missed the playoffs due to a tie breaker with the Cincinnati Reds. The reason for their complete and utter capitulation is as varied as it is mysterious, but a lot of it came down to bad luck. They had the run differential of an 86-76 team, and finished the season with the sixth-best position player WAR (28.1), tenth-best pitcher WAR (17.1), and fifth-best overall WAR (45.2), according to Fangraphs. Wins above replacement (WAR) has a very strong correlation to wins, hence the name, and the Mets underperformed their underlying production by a massive margin. Among teams with 40+ total team WAR, the lowest win total, excluding the Mets, were the Red Sox’s 89. Using a linear forecast model, the Mets underperformed their expected win total, based on WAR, by -8.6, the second largest underperformance in the league. Simply put, the front office built a very strong team that got ravaged by the baseball gods. Biggest WAR Underperformers 2025 Rk Team WAR (Pitch) WAR (Position) Total WAR Wins WAR Forecast Wins Forecast Wins - Wins 1 MIN 15.5 16.2 31.7 70 79.54 -9.54 2 NYM 17.1 28.1 45.2 83 91.60 -8.60 3 CHW 10.6 6.5 17.1 60 66.49 -6.49 4 COL 0.4 -3.1 -2.7 43 48.80 -5.80 5 ARI 9.5 27.2 36.7 80 84.01 -4.01 6 ATL 11.7 19.7 31.4 76 79.27 -3.27 7 PIT 19.4 5.7 25.1 71 73.64 -2.64 8 NYY 16.7 33.5 50.2 94 96.07 -2.07 9 LAD 20.2 28.8 49 93 95.00 -2.00 10 BOS 18.1 26.3 44.4 89 90.89 -1.89 A common refrain you’ll hear fans say when a team underperforms their underlying metrics is you can’t build a team in a spreadsheet. To that I say, “You only say that when things go wrong.” Every MLB team is built using statistics. Sometimes things go wrong, sometimes things go right, but baseball is an exceedingly random sport played on the finest of margins. The 2025 Mets were just a casualty of uncertainty, but 2026 has been a whole different ballgame. 2026: The Year Everything Went Wrong Giving the front office a mulligan for 2025 would be appropriate. The team was legitimately good, and in most worlds they coast to the playoffs. Unfortunately, the 2026 team has actually been awful, and few of Stearns' offseason moves have worked out. The signing of Bo Bichette has been an unmitigated disaster, Marcus Semien looks as cooked as burnt toast, and Pete Alonso has been exceptional in Baltimore. These three decisions have completely colored Stearns' tenure, but it’s probably not fair to say they were all bad ideas. First and foremost, Bichette’s struggles came completely out of nowhere. He has a career wRC+ of 118, was coming off a season with a wRC+ of 134, and was entering his age-28 season. Every team, finances permitting, would have signed him to that exact same three-year, $126 million deal the Mets did. His second-half wRC+ of 110 offers hope that should he exercise his player option the Mets will have the player they thought they signed. Trading Brandon Nimmo for Semien, and subsequently offloading Jeff McNeil, was about cleaning up the present and future of their finances while offering an opening for their young outfielders. Player Age (2026) 2026 2027 2028 2029 2030 Marcus Semien 35 $26,000,000 $26,000,000 $20,000,000 Brandon Nimmo 33 $20,500,000 $20,500,000 $20,500,000 $20,500,000 $20,500,000 Jeff McNeil 34 $15,750,000 $2,000,00 (Buy Out) With Nimmo out of the way, the Mets were able to promote Carson Benge—more on him later—and it also opened an avenue for A.J. Ewing in center. The hope that Semien still had something in the tank was a real risk, but his deal will be much more palatable to move or eat than Nimmo’s would have been. Unfortunately, letting Pete Alonso walk and replacing him with Jorge Polanco and the hope that Mark Vientos would stop being Mark Vientos has been an actual disaster. Committing $155 million to a first base, bat-only slugger entering their age-31 season is scary. The list of generationally awful contracts that have gone to players in that mold is a who’s who of regret: Albert Pujols, Miguel Cabrera, Chris Davis, and Ryan Howard, to name a few. On its face, Stearns decision is defensible, but the way it has played out has been about as bad as possible. Alonso has been fantastic this season, Polanco has either been injured and/or awful, and Vientos’ fantastic 2024 is looking like a total fluke. By the end of Alonso’s deal, Stearns will probably look vindicated, because he didn’t balk at $31 million in 2026, he balked at $31 million in 2030, but he’ll have to make it that far. Over Stearns' first three seasons at the helm, the on-field product has actually been solid. The problem is the implied trajectory. Going from 89 to 83 to 69 (and counting) wins does not inspire confidence that he is improving the team. Of course, that fails to acknowledge that MLB organizations are about more than the big-league club. The Hidden Rebuild Stearns was fundamentally brought in to rebuild the Mets. The hope was he could overhaul the Mets’ amateur scouting and development systems, while the big-league club stayed competitive, but he faced two serious challenges. The first was that the team he inherited was incredibly old, and the second was that the Mets' top prospects from the previous regime have largely faltered. Stearns has done an excellent job bringing the average age of the roster down. They were one of the oldest teams in the National League his first two seasons, but currently rank eighth in average position player age and fifth in average pitcher age. Considering the moves made at the deadline, there’s a good chance the team is even younger in 2027, and if it isn’t, that means veteran reinforcements. Season 2023 2024 2025 2026 Ave Pitcher Age 31.9 31 30.7 30.2 Ave Position Age 28.9 30 28.9 27.7 The youth movement might be underway, but the stagnation of Brett Baty and Francisco Alvarez has set the Mets back substantially in the short term. When Stearns took over in the fall of 2023, Baty was entering his age-25 season and Alvarez his age-23 campaign. They were supposed to be the heirs to the rapidly aging core, but both have struggled to make an impact. Since 2024, Alvarez has produced a total of 3.0 bWAR, at an average of 1.7 bWAR per 162 games, while Baty comes in at 4.3 for an average of 2.2 per 162 games. However, 3.0 of Baty’s bWAR came in 2025 alone, which means he’s been basically a replacement level player in two of the past three seasons. The truth is most prospects, even top ones, don’t become MVPs and All-Stars, but Baty at one point had a 55 grade and Alvarez a 60. Their current production, in particular Alvarez’s, is running well short of those grades, and it temporarily collapsed the Mets’ bridge to the future. This context is important because Stearns first draft was in 2024, which means few of his front office’s hand-picked players have had enough time to reach the bigs, except for one. The first pick Stearns made as the head of the Mets was Carson Benge, which seems to be working out pretty well. Time will tell about his other picks, but he has been able to build up the Mets’ farm system, without access to top tier draft picks. Farm System Overview Draft Picks Season Overall Rank Farm Value (in millions) Top-30 Picks Top-50 Picks Top-75 Picks Top-100 Picks Top-150 Picks 2023 6 $280 0 1 2 3 7 2024 16 $178 1 2 2 3 5 2025 7 $242 0 1 1 1 3 2026 6 $492 1 1 1 2 3 *Fangraphs organizational prospect rankings and value. In 2026 they changed their prospect valuation model The Mets have had a grand total of 11 picks within the top 150 since 2024, but have still managed to build and maintain a top-10 farm system. Part of that is down to the players he inherited, but they have done well in the international market, trades, and improved internal development. Stearns might not have drafted Nolan McLean, but he went from a third-round pick to the top pitching prospect under his watch. All told, Stearns has brought in six of the Mets current top-10 prospects, and dramatically improved the stock of countless pitchers already in the organization. So, while the big-league club has underperformed, the rest of the organization looks far healthier. The Blueprint and Finances However, the real question probably isn’t: Does David Stearns deserve to keep his job? The question is: What was his job? If Stearns was brought in to try and win a championship right away, then he’s failed. However, if his job was to build the infrastructure to consistently churn out major-league talent, then everything appears to be on track. That’s probably not a satisfying answer, but it’s the exact blueprint the Dodgers used to become the best team in baseball. They lost their cheap-o owners, brought in an Ivy league wiz to build an exceptional baseball development infrastructure, and then weaponized their financial resources to push them over the top. It’s easy to forget due to their decade-long run of dominance, but it took the Dodgers eight seasons to finally win a World Series. And while they were a perennial playoff team from the jump, they did have one sizable advantage over the Stearns-era Mets: money. When the Dodgers sold to Guggenheim Baseball Management in 2012, they had a payroll of $116.7 million, the ninth-highest in baseball, and over $100 million short of the Yankees' league-leading figure of $225.6 million. By 2013 (that’s one offseason for those that are counting) the Dodgers led baseball in payroll at $236.7 million. For as much as Cohen has talked about spending, and he has, Stearns never had the financial runway to completely remake the Mets' roster through cash. Season Total Salary RK 2023 $347,949,991 1 2024 $322,960,494 1 2025 $342,303,011 2 2026 $344,556,436 2 Truthfully, any team with a $300 million payroll should always be a playoff quality team, which makes 2026 such a disappointing, near-inexcusable season. But Stearns has positioned the Mets to have a ton of resources to quickly rebuild the squad for 202, assuming MLB doesn’t get their wish with a salary cap. Right now, the Mets have $267.7 million in guaranteed salary for 2027, which gives them over $70 million to add to the roster, should they maintain their current spending levels. The 2026-27 free agent class gets pretty thin after Tarik Skubal, but it is heavy on quality veteran arms. On top of that, the Mets’ long-term salary situation is pretty rosy. The only guaranteed contracts on their books for 2029 are Juan Soto and Francisco Lindor, two future Hall of Famers. While this doesn’t include any of their young core, they’ll all still be going through the arbitration process, meaning the Mets will be serious players to add high-end talent for the rest of the decade. Contrast that with the Dodgers, who have $238.5 million committed to seven players who will all be well into their 30s in 2029. While I completely understand the current fan sentiment towards David Stearns, it conveniently ignores all of the good he has done. The organization is in a much healthier place than when he took over. Their MiLB affiliates and development pipeline looks far better and their books are relatively clean going forward. Sure, he let Pete Alonso walk in free agency, but Alonso’s production wouldn’t have turned this team into a playoff team. Every front office makes mistakes. Stearns has made his. But he finally has the Mets looking like a sleeping giant ready to wake.
 -
Image courtesy of © Nathan Ray Seebeck-Imagn Images Fresh off writing the New York Mets’ hitters of the month piece for August, an odd detail caught my eye: Bo Bichette had an excellent 135 wRC+ in August, but managed to produce a negative win probability added (WPA). This isn’t a cause for alarm, but it is interesting. Those stats (wRC+ and WPA) are strongly correlated because hitting well is good for winning, so I figured further investigation was necessary. There are a few ways a hitter can hit well without helping his team’s chances of winning. The first is to rarely come up with runners on base or in scoring position. As great as a leadoff double is, the single that knocks them in improves your chances of winning more. The second is doing damage when the game is not close. If you’re up eight or down eight in the late innings, even a grand slam doesn’t change your odds all that much. The third is not having many leverage opportunities. And somehow, Bichette managed a trifecta. Of Bichette’s 109 plate appearances in August, 69 came with no runners on, and only 23 came with runners in scoring position. To make matters worse, Bichette saved his slugging for when the bases were empty. All four of his home runs, five of his seven doubles, and his lone triple came with no runners on. Bo Bichette Bases Empty Men On Total PA 69 40 109 1B 7 10 17 2B 5 2 7 3B 1 0 1 HR 4 0 4 BB 6 3 9 SO 14 6 20 Ave 0.270 0.324 0.290 OBP 0.333 0.375 0.349 Slugging 0.571 0.378 0.500 BB% 8.70% 7.50% 8.26% K% 20.29% 15.00% 18.35% On top of having no one on, three of Bichette’s August home runs came with the Mets up by at least three runs. And his lone home run to break a deadlock was in the first inning, when a 1-0 lead is the most vulnerable. Finally, Bichette’s average Leverage Index (0.89) for the month ranked 178th out of 190 qualified hitters. Now, that doesn’t necessarily doom you to a low WPA, as Alex Bregman had an identical Leverage Index and led baseball in WPA for August, but he posted a 177 wRC+ and hit three home runs in a single game twice. Opportunity is a big driver in context-based statistics, and Bichette didn’t really have the chance to shine. His -0.03 WPA was mostly driven by his 120th-ranked +1.75 win advancement, not his 60th-ranked -1.78 loss advancement. He wasn’t awful in leverage situations; he just didn’t have enough of them. This isn't proof that Bichette is some unclutch stiff who can only get it done when the pressure is off. He’s a career 118 wRC+ hitter with a positive clutch score, after all. However, even when a good hitter has it going, if the opportunities and sequencing are off, their impact on winning can be limited. I’ll stress: don’t hate the player, hate the game. Because that’s just baseball. View full article
-
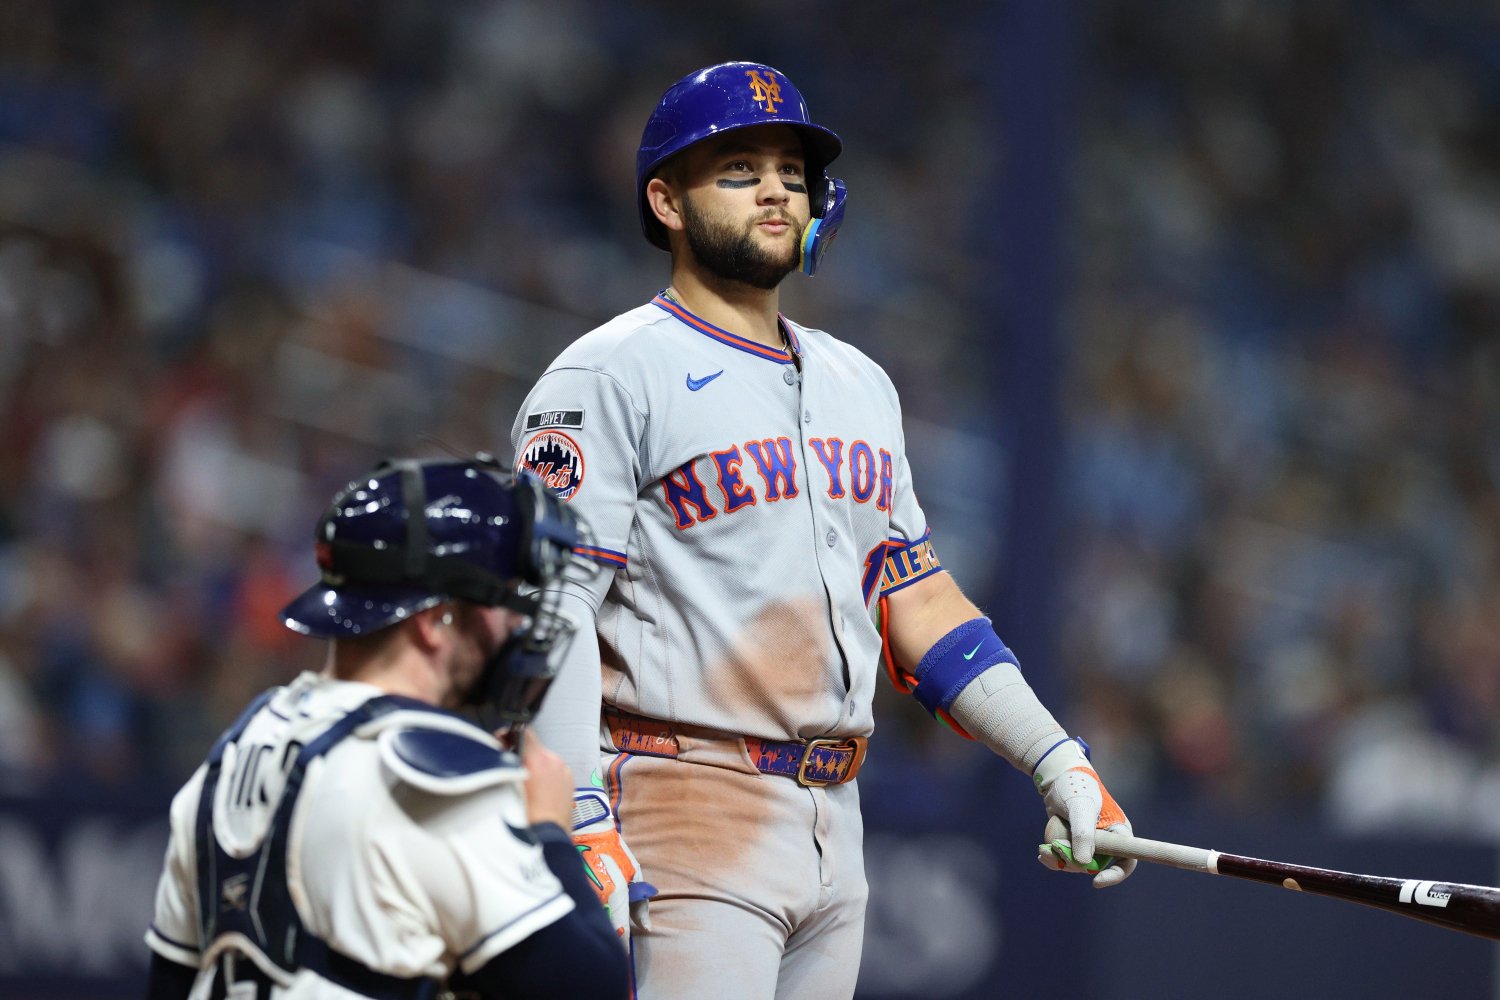 Fresh off writing the New York Mets’ hitters of the month piece for August, an odd detail caught my eye: Bo Bichette had an excellent 135 wRC+ in August, but managed to produce a negative win probability added (WPA). This isn’t a cause for alarm, but it is interesting. Those stats (wRC+ and WPA) are strongly correlated because hitting well is good for winning, so I figured further investigation was necessary. There are a few ways a hitter can hit well without helping his team’s chances of winning. The first is to rarely come up with runners on base or in scoring position. As great as a leadoff double is, the single that knocks them in improves your chances of winning more. The second is doing damage when the game is not close. If you’re up eight or down eight in the late innings, even a grand slam doesn’t change your odds all that much. The third is not having many leverage opportunities. And somehow, Bichette managed a trifecta. Of Bichette’s 109 plate appearances in August, 69 came with no runners on, and only 23 came with runners in scoring position. To make matters worse, Bichette saved his slugging for when the bases were empty. All four of his home runs, five of his seven doubles, and his lone triple came with no runners on. Bo Bichette Bases Empty Men On Total PA 69 40 109 1B 7 10 17 2B 5 2 7 3B 1 0 1 HR 4 0 4 BB 6 3 9 SO 14 6 20 Ave 0.270 0.324 0.290 OBP 0.333 0.375 0.349 Slugging 0.571 0.378 0.500 BB% 8.70% 7.50% 8.26% K% 20.29% 15.00% 18.35% On top of having no one on, three of Bichette’s August home runs came with the Mets up by at least three runs. And his lone home run to break a deadlock was in the first inning, when a 1-0 lead is the most vulnerable. Finally, Bichette’s average Leverage Index (0.89) for the month ranked 178th out of 190 qualified hitters. Now, that doesn’t necessarily doom you to a low WPA, as Alex Bregman had an identical Leverage Index and led baseball in WPA for August, but he posted a 177 wRC+ and hit three home runs in a single game twice. Opportunity is a big driver in context-based statistics, and Bichette didn’t really have the chance to shine. His -0.03 WPA was mostly driven by his 120th-ranked +1.75 win advancement, not his 60th-ranked -1.78 loss advancement. He wasn’t awful in leverage situations; he just didn’t have enough of them. This isn't proof that Bichette is some unclutch stiff who can only get it done when the pressure is off. He’s a career 118 wRC+ hitter with a positive clutch score, after all. However, even when a good hitter has it going, if the opportunities and sequencing are off, their impact on winning can be limited. I’ll stress: don’t hate the player, hate the game. Because that’s just baseball.
 -
New York Mets Hitters of the Month, August 2026: Carson Benge Goes Nuclear
N.B. Lindberg posted an article in Mets
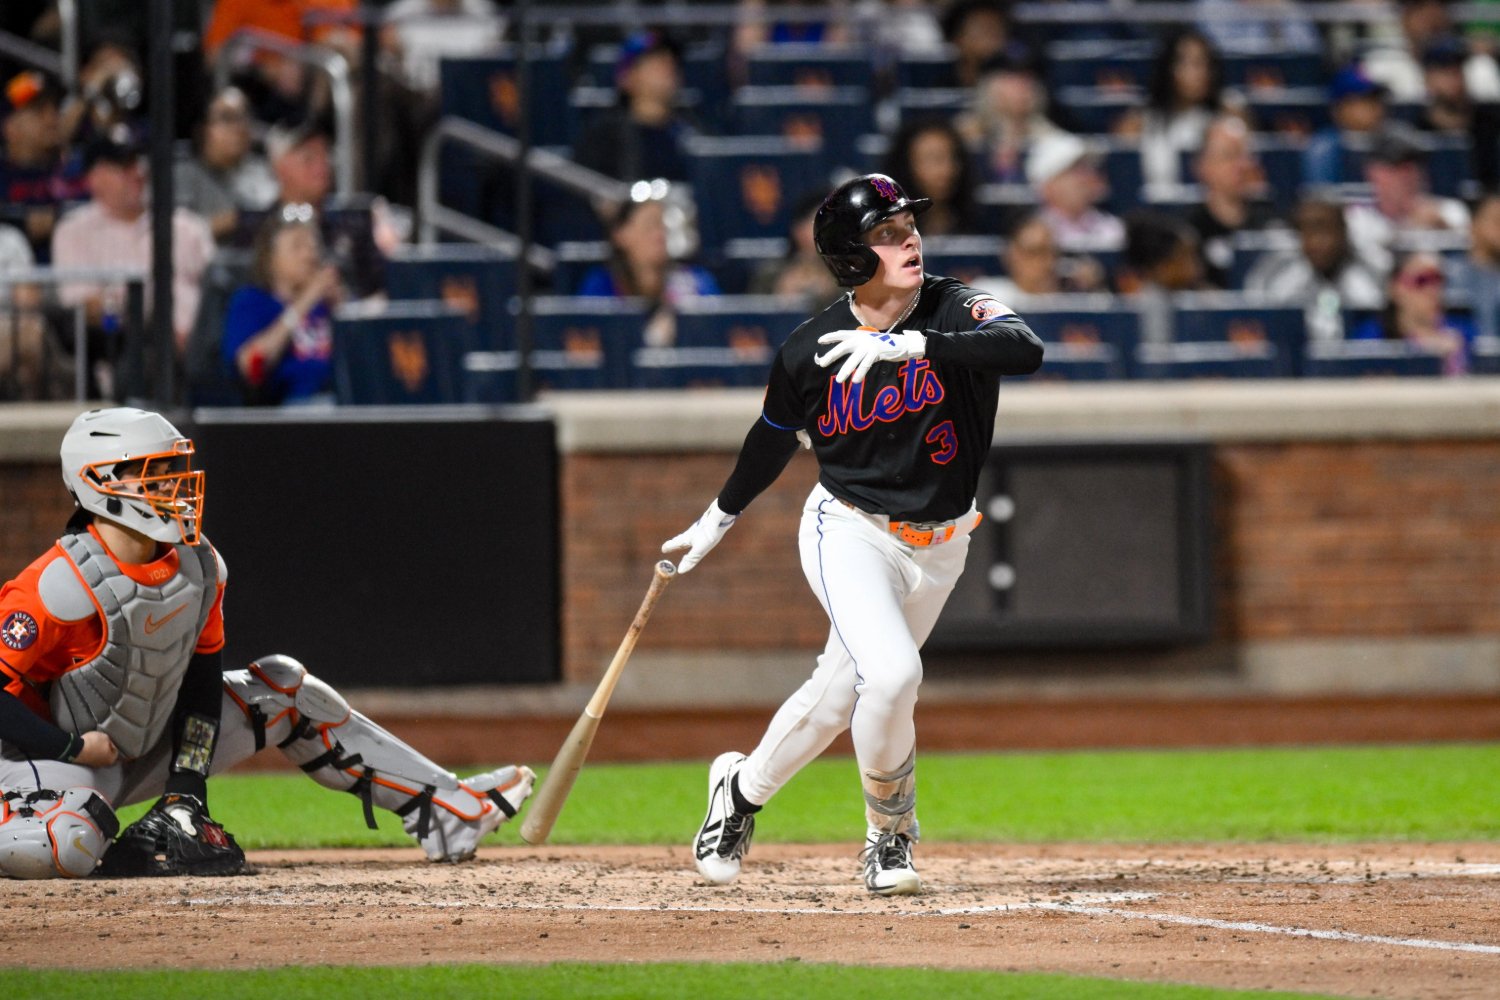 August marked the New York Mets' best month since their ultimately futile May. A 15-12 record was never going to get them back in the playoff mix, but it does portend a far brighter 2027. And when you consider that Juan Soto only graced the batters’ box nine times in August, the Mets’ performance looks a whole lot more promising. With apologies to Luis Torrens, who has been absolutely bonkers in August to the tune of six home runs, a .325 average, .386 on-base, and .775 slugging percentage—but 44 plate appearances isn’t enough to qualify for the monthly leaderboard, and that’s where I draw the line—these are the three Mets who have powered the offense. Ranking Mets' Best Hitters In August No. 3 Bo Bichette, 3B If every month had been like August for Bo Bichette, his and the Mets’ season could look very different. His 135 wRC+ ranks second among qualified Mets, and his triple-slash line of .290/.349/.500 is exactly the type of production fans envisioned when he signed his three-year, $126 million deal. While Bichette has outperformed his Statcast data, everything about his August looks like the hitter he showed to be in Toronto. He’s hitting the ball hard, racking up line drives, and has even seen his walk rate improve to 8.3%. Bichette is one of the few hitters who can hit four home runs in a month and still post a .500 slugging percentage. The only reason he doesn’t rank a spot higher is that he hasn’t been nearly as timely as he has been productive. Because this is the 2026 Mets, somehow, someway, Bichette produced a 135 wRC+ and a negative win probability added (-0.06 WPA) in the same month. I wouldn’t read too much into that, but when you hit is almost as important as how you hit, and in that department, Bichette came up just a bit short. No. 2 Luis Robert Jr., OF Like last month, a now-former Met makes the list. The Mets’ decision to place Luis Robert Jr. on waivers was purely financial. Due to their luxury tax situation, the $3 million owed to Robert over the remainder of the season would cost the Mets $6.3 million. On top of that, with a $2 million buyout or $20 million team option for next season, it’s not unsurprising the Mets looked to get off his deal now, and thankfully he delivered in August. Over 84 plate appearances, Robert produced a 128 wRC+ thanks to six home runs and a .520 slugging percentage. He still struck out a bit too much (26.2%) and walked a tad too infrequently (8.3%), but slugging cures a lot of sins. On top of that, Robert came up in leverage situations for the Mets. His 0.48 WPA was second on the Mets in August, as was his 0.19 Clutch rating. If it wasn’t for Robert’s strong showing in August, it’s very unlikely the Orioles would have claimed him off waivers. While I’d never suggest fans rooting for owners to save money, if the Mets take some of those savings and reinvest them in the 2027 team, then Robert’s final month will have been a nice little parting gift. No. 1 Carson Benge, OF Could it have been anyone else? Benge led qualified Mets in wRC+ (143) and WPA (+0.77), and that doesn’t even include his pair of ludicrous outfield assists in the same inning. Back to the hitting side of the equation. Benge was an absolute menace for opposing pitchers. He slashed .317/.367/.515 on the back of five home runs, three doubles, and a triple. Despite posting the lowest monthly average exit velocity of his young career, Benge prospered by lifting the ball more than ever. That type of strategy won’t continue to yield a .300 average, but it will lead to an increased power output. In what has been a down season for the Mets, Benge, following a rough April, has been a steady performer thanks to constant adjustments. In May, he turned his season around by peppering line drives. In July, he walked more than ever. And in August, he decided to lift the ball with increased frequency. If he ever puts it all together, watch out.
 -
Image courtesy of © John Jones-Imagn Images August marked the New York Mets' best month since their ultimately futile May. A 15-12 record was never going to get them back in the playoff mix, but it does portend a far brighter 2027. And when you consider that Juan Soto only graced the batters’ box nine times in August, the Mets’ performance looks a whole lot more promising. With apologies to Luis Torrens, who has been absolutely bonkers in August to the tune of six home runs, a .325 average, .386 on-base, and .775 slugging percentage—but 44 plate appearances isn’t enough to qualify for the monthly leaderboard, and that’s where I draw the line—these are the three Mets who have powered the offense. Ranking Mets' Best Hitters In August No. 3 Bo Bichette, 3B If every month had been like August for Bo Bichette, his and the Mets’ season could look very different. His 135 wRC+ ranks second among qualified Mets, and his triple-slash line of .290/.349/.500 is exactly the type of production fans envisioned when he signed his three-year, $126 million deal. While Bichette has outperformed his Statcast data, everything about his August looks like the hitter he showed to be in Toronto. He’s hitting the ball hard, racking up line drives, and has even seen his walk rate improve to 8.3%. Bichette is one of the few hitters who can hit four home runs in a month and still post a .500 slugging percentage. The only reason he doesn’t rank a spot higher is that he hasn’t been nearly as timely as he has been productive. Because this is the 2026 Mets, somehow, someway, Bichette produced a 135 wRC+ and a negative win probability added (-0.06 WPA) in the same month. I wouldn’t read too much into that, but when you hit is almost as important as how you hit, and in that department, Bichette came up just a bit short. No. 2 Luis Robert Jr., OF Like last month, a now-former Met makes the list. The Mets’ decision to place Luis Robert Jr. on waivers was purely financial. Due to their luxury tax situation, the $3 million owed to Robert over the remainder of the season would cost the Mets $6.3 million. On top of that, with a $2 million buyout or $20 million team option for next season, it’s not unsurprising the Mets looked to get off his deal now, and thankfully he delivered in August. Over 84 plate appearances, Robert produced a 128 wRC+ thanks to six home runs and a .520 slugging percentage. He still struck out a bit too much (26.2%) and walked a tad too infrequently (8.3%), but slugging cures a lot of sins. On top of that, Robert came up in leverage situations for the Mets. His 0.48 WPA was second on the Mets in August, as was his 0.19 Clutch rating. If it wasn’t for Robert’s strong showing in August, it’s very unlikely the Orioles would have claimed him off waivers. While I’d never suggest fans rooting for owners to save money, if the Mets take some of those savings and reinvest them in the 2027 team, then Robert’s final month will have been a nice little parting gift. No. 1 Carson Benge, OF Could it have been anyone else? Benge led qualified Mets in wRC+ (143) and WPA (+0.77), and that doesn’t even include his pair of ludicrous outfield assists in the same inning. Back to the hitting side of the equation. Benge was an absolute menace for opposing pitchers. He slashed .317/.367/.515 on the back of five home runs, three doubles, and a triple. Despite posting the lowest monthly average exit velocity of his young career, Benge prospered by lifting the ball more than ever. That type of strategy won’t continue to yield a .300 average, but it will lead to an increased power output. In what has been a down season for the Mets, Benge, following a rough April, has been a steady performer thanks to constant adjustments. In May, he turned his season around by peppering line drives. In July, he walked more than ever. And in August, he decided to lift the ball with increased frequency. If he ever puts it all together, watch out. View full article
-
Image courtesy of © Vincent Carchietta-Imagn Images Despite surrendering a walk-off home run to Tristan Peters, Kodai Senga’s transition to a single-inning reliever has been far more fruitful than this season’s work out of the rotation. Since making the switch on August 4, Senga has featured eight times, thrown 7.1 innings, and posted a 2.45 ERA. It’s a small sample, but it stands in stark contrast to the 8.66 ERA he managed over his prior 44.2 innings of work. Now, with Devin Williams on the injured list due to a shoulder strain, Senga is the New York Mets' de facto closer, and his relative success has piqued fans' interest. Could Senga be the Mets’ answer at closer in 2027? Perhaps he’s this generation’s Koji Uehara? Or is this stellar run a small sample blip? Oh, and as for Devin Williams, cue the Simple Minds. The biggest obstacle to Senga closing in 2027 is himself. It wasn’t that long ago that he was a legitimate starting pitcher. In 2023, his rookie season, he ghost-forked his way to a 2.98 ERA over 166.1 innings, finishing second in Rookie of the Year voting and seventh in the NL Cy Young. His follow-up campaign was derailed by injury, but in 2025, he posted a 3.02 ERA over 113.1 innings. At that point, over 285 innings, Senga owned a career 3.00 ERA as a starter. All of this is to say, if he gets right in the bullpen, it makes all the sense in the world to see if he can start again, and if he doesn’t get right in the bullpen, it makes no sense to hand him the closer role. Then there’s the question of whether he has gotten right. Obviously, a 2.45 ERA is far better than 8.66, but that doesn’t mean he’s suddenly fixed. First and foremost, Senga’s biggest problem this season has been a sky-high walk rate. Prior to Aug. 4, his 15.2% walk rate was the highest among any pitcher with over 40 innings pitched, and since moving to a single-inning reliever role, he has cut it to 12.9%. That’s a significant improvement, but it’s still an abysmal walk rate. The highest qualified walk rate among starting pitchers is 11.7%, and that 12.9% mark would still be the 20th-worst among all qualified relievers. On top of that, his underlying strike-zone data doesn’t suggest much, if any, improvement. Two of the best predictors for walk rate are first-pitch strike percentage and in-zone percentage. So, it might surprise you to learn that Senga’s first-pitch strike rate and zone rate have both been worse since the trade deadline. Pre August 4th Post August 4th BB% 15.20% 12.90% F-Strike% 55.2% 51.6% Zone% 47.9% 46.9% O-Swing% 25.9% 25.0% Z-Swing% 66.2% 60.0% Swing% 45.2% 41.4% O-Conact% 43.8% 41.2% Z-Contact% 85.6% 88.9% Contact% 73.1% 73.6% SwStrk% 12.2% 10.9% Based on the strike-zone data, it appears that Senga’s control has gotten even worse, but that’s not completely fair to him. While he isn’t pounding the zone at an increased frequency, he is throwing the ball in better places. Contrary to what your Little League coach might have said, throwing the ball right down the middle is bad advice, and before Aug. 4, that’s where 11.6% of Senga’s pitches went. It was by far his most frequented zone, and it’s part of why he allowed 2.42 home runs per nine innings. However, since moving into a single-inning role, he has cut that figure to 3.7%, and his most frequented zone has been the center-bottom of the strike zone at 14.3%. Despite not throwing more strikes, he is throwing better strikes, which has helped him limit damage on contact, rack up more strikeouts, and limit walks. But that still doesn’t mean he should be the Mets closer in 2027. Senga has legitimately pitched better since his role shift, but we’re talking about 7.1 innings with a moderate improvement in command. On top of that, while his 2.45 ERA is excellent, all of the ERA estimators think he is riding his luck. His xERA is 3.33, his FIP is 4.45, and his xFIP is 3.91. Those are all far better than what he managed earlier in the season, but they’re not anywhere near closer level. Among qualified relievers, a 3.33 xERA would rank 51st, a 4.45 FIP would rank 130th, and a 3.91 xFIP would tie for 65th. There’s also the little issue, if you want to call it that, of Devin Williams. This might be grating for some to hear, but Williams is still an excellent reliever, despite two seasons of rotten luck. From 2020 to 2024, he was arguably the best reliever in baseball. He racked up the second-most fWAR (7.6), had the second-best ERA (1.70), and the third-best FIP (2.24). He struck guys out, limited damage on contact, and while he issued a few more walks than you’d like, clearly it was worth it. Then he was traded to the Yankees, and everything and nothing changed. In his lone season in the Bronx, Williams posted a career-high 4.79 ERA, despite a 3.05 xERA, 2.68 FIP, and 2.95 xFIP, and it wasn’t hard to spot the culprit. After sporting a left-on-base percentage (LOB%) of 82.8% from 2020 to 2024, Williams saw it plummet to 55.2%. That is the 30th-lowest LOB% among all relievers since 1945. His luck went beyond bad, and it’s why the Mets offered him a three-year, $51 million deal in the offseason. Unfortunately, 2026 has also been another snake-bitten year for Williams, but in a different way. His 4.66 ERA looks bad, and it is, but his 3.29 xERA, 3.09 FIP, and 3.60 xFIP all suggest he is still a strong reliever. The problem is that this season his BABIP is an astronomical .388. While some pitchers earn their elevated BABIP, Williams does not. This season, among pitchers who have thrown 40 innings or more, the linear correlation between hard-hit balls (balls hit harder than 95 MPH) and hits allowed is 0.975. Basically, if you know how many hard-hit balls a pitcher has given up, you know how many hits they should have given up. And since the league average hard-hit ball to hit rate is 0.815, you’d assume that Williams, who has allowed 31 hard-hit balls, would have allowed 25 hits, not the 43 he has actually allowed. While it is true that Williams has not been as good since leaving Milwaukee, he has also had awful, nearly incomprehensible misfortune. And his series of unfortunate batted-ball events has only compounded the issue. Pitchers, almost universally, pitch better with the bases empty. Given a pseudo-normal season, he’ll look largely like the pitcher the Mets thought they were signing. Kodai Senga’s mini-resurgence is a nice little story and offers more hope of him contributing meaningfully to the 2027 squad, but it would be patently insane to suggest he deserves the inside track on the closer job. Even while pitching better, he hasn’t pitched that well. On top of that, Devin Williams is undoubtedly better than his results. Heading into next year, the Mets will hope that Senga can regain a starting spot, and Williams will stop being cursed. If Senga actually ends up the closer in 2027, then that’s a worst-case scenario for everyone. View full article
-
Kodai Senga Still Hasn't Usurped Devin Williams As Mets' Future Closer
N.B. Lindberg posted an article in Mets
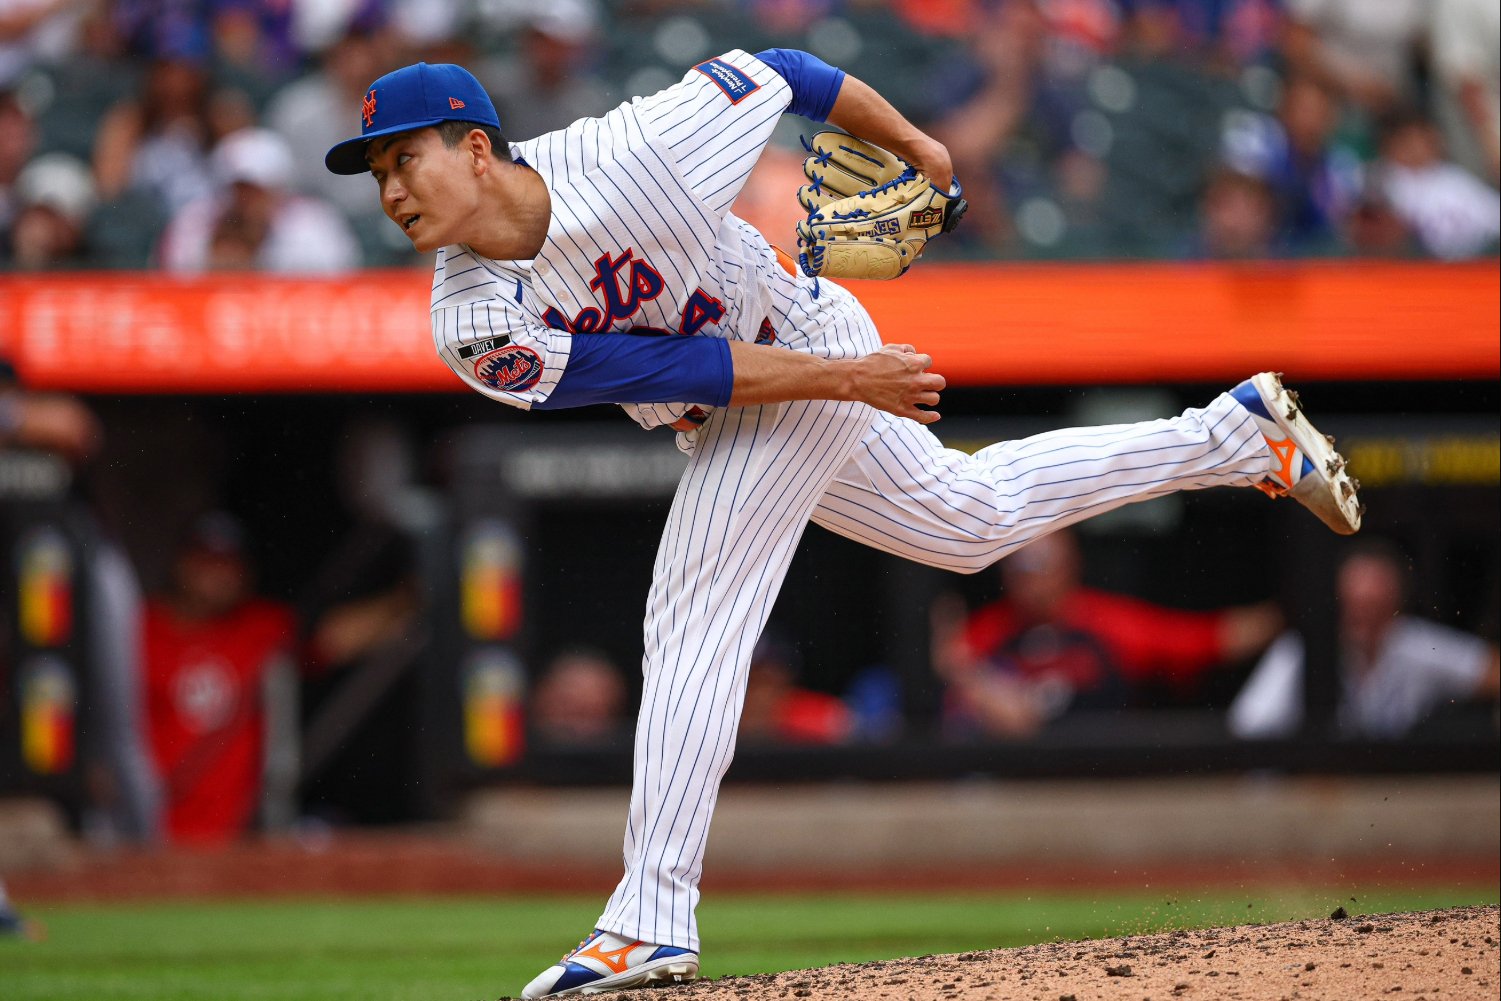 Despite surrendering a walk-off home run to Tristan Peters, Kodai Senga’s transition to a single-inning reliever has been far more fruitful than this season’s work out of the rotation. Since making the switch on August 4, Senga has featured eight times, thrown 7.1 innings, and posted a 2.45 ERA. It’s a small sample, but it stands in stark contrast to the 8.66 ERA he managed over his prior 44.2 innings of work. Now, with Devin Williams on the injured list due to a shoulder strain, Senga is the New York Mets' de facto closer, and his relative success has piqued fans' interest. Could Senga be the Mets’ answer at closer in 2027? Perhaps he’s this generation’s Koji Uehara? Or is this stellar run a small sample blip? Oh, and as for Devin Williams, cue the Simple Minds. The biggest obstacle to Senga closing in 2027 is himself. It wasn’t that long ago that he was a legitimate starting pitcher. In 2023, his rookie season, he ghost-forked his way to a 2.98 ERA over 166.1 innings, finishing second in Rookie of the Year voting and seventh in the NL Cy Young. His follow-up campaign was derailed by injury, but in 2025, he posted a 3.02 ERA over 113.1 innings. At that point, over 285 innings, Senga owned a career 3.00 ERA as a starter. All of this is to say, if he gets right in the bullpen, it makes all the sense in the world to see if he can start again, and if he doesn’t get right in the bullpen, it makes no sense to hand him the closer role. Then there’s the question of whether he has gotten right. Obviously, a 2.45 ERA is far better than 8.66, but that doesn’t mean he’s suddenly fixed. First and foremost, Senga’s biggest problem this season has been a sky-high walk rate. Prior to Aug. 4, his 15.2% walk rate was the highest among any pitcher with over 40 innings pitched, and since moving to a single-inning reliever role, he has cut it to 12.9%. That’s a significant improvement, but it’s still an abysmal walk rate. The highest qualified walk rate among starting pitchers is 11.7%, and that 12.9% mark would still be the 20th-worst among all qualified relievers. On top of that, his underlying strike-zone data doesn’t suggest much, if any, improvement. Two of the best predictors for walk rate are first-pitch strike percentage and in-zone percentage. So, it might surprise you to learn that Senga’s first-pitch strike rate and zone rate have both been worse since the trade deadline. Pre August 4th Post August 4th BB% 15.20% 12.90% F-Strike% 55.2% 51.6% Zone% 47.9% 46.9% O-Swing% 25.9% 25.0% Z-Swing% 66.2% 60.0% Swing% 45.2% 41.4% O-Conact% 43.8% 41.2% Z-Contact% 85.6% 88.9% Contact% 73.1% 73.6% SwStrk% 12.2% 10.9% Based on the strike-zone data, it appears that Senga’s control has gotten even worse, but that’s not completely fair to him. While he isn’t pounding the zone at an increased frequency, he is throwing the ball in better places. Contrary to what your Little League coach might have said, throwing the ball right down the middle is bad advice, and before Aug. 4, that’s where 11.6% of Senga’s pitches went. It was by far his most frequented zone, and it’s part of why he allowed 2.42 home runs per nine innings. However, since moving into a single-inning role, he has cut that figure to 3.7%, and his most frequented zone has been the center-bottom of the strike zone at 14.3%. Despite not throwing more strikes, he is throwing better strikes, which has helped him limit damage on contact, rack up more strikeouts, and limit walks. But that still doesn’t mean he should be the Mets closer in 2027. Senga has legitimately pitched better since his role shift, but we’re talking about 7.1 innings with a moderate improvement in command. On top of that, while his 2.45 ERA is excellent, all of the ERA estimators think he is riding his luck. His xERA is 3.33, his FIP is 4.45, and his xFIP is 3.91. Those are all far better than what he managed earlier in the season, but they’re not anywhere near closer level. Among qualified relievers, a 3.33 xERA would rank 51st, a 4.45 FIP would rank 130th, and a 3.91 xFIP would tie for 65th. There’s also the little issue, if you want to call it that, of Devin Williams. This might be grating for some to hear, but Williams is still an excellent reliever, despite two seasons of rotten luck. From 2020 to 2024, he was arguably the best reliever in baseball. He racked up the second-most fWAR (7.6), had the second-best ERA (1.70), and the third-best FIP (2.24). He struck guys out, limited damage on contact, and while he issued a few more walks than you’d like, clearly it was worth it. Then he was traded to the Yankees, and everything and nothing changed. In his lone season in the Bronx, Williams posted a career-high 4.79 ERA, despite a 3.05 xERA, 2.68 FIP, and 2.95 xFIP, and it wasn’t hard to spot the culprit. After sporting a left-on-base percentage (LOB%) of 82.8% from 2020 to 2024, Williams saw it plummet to 55.2%. That is the 30th-lowest LOB% among all relievers since 1945. His luck went beyond bad, and it’s why the Mets offered him a three-year, $51 million deal in the offseason. Unfortunately, 2026 has also been another snake-bitten year for Williams, but in a different way. His 4.66 ERA looks bad, and it is, but his 3.29 xERA, 3.09 FIP, and 3.60 xFIP all suggest he is still a strong reliever. The problem is that this season his BABIP is an astronomical .388. While some pitchers earn their elevated BABIP, Williams does not. This season, among pitchers who have thrown 40 innings or more, the linear correlation between hard-hit balls (balls hit harder than 95 MPH) and hits allowed is 0.975. Basically, if you know how many hard-hit balls a pitcher has given up, you know how many hits they should have given up. And since the league average hard-hit ball to hit rate is 0.815, you’d assume that Williams, who has allowed 31 hard-hit balls, would have allowed 25 hits, not the 43 he has actually allowed. While it is true that Williams has not been as good since leaving Milwaukee, he has also had awful, nearly incomprehensible misfortune. And his series of unfortunate batted-ball events has only compounded the issue. Pitchers, almost universally, pitch better with the bases empty. Given a pseudo-normal season, he’ll look largely like the pitcher the Mets thought they were signing. Kodai Senga’s mini-resurgence is a nice little story and offers more hope of him contributing meaningfully to the 2027 squad, but it would be patently insane to suggest he deserves the inside track on the closer job. Even while pitching better, he hasn’t pitched that well. On top of that, Devin Williams is undoubtedly better than his results. Heading into next year, the Mets will hope that Senga can regain a starting spot, and Williams will stop being cursed. If Senga actually ends up the closer in 2027, then that’s a worst-case scenario for everyone.
 -
Image courtesy of © Vincent Carchietta-Imagn Images Christian Scott throws right-handed, unleashes his curveball and splitter a combined 9% of the time, and leans heavily on the tried-and-true fastball-slider combination. Based on those details, it shouldn’t be too surprising to learn that out of the 340 batters he has faced this season, 214 (63%) of them have been left-handed. You can’t fault opposing managers for stacking the lineup card with left-handed sticks against a righty without a traditional platoon neutralizer, but they’re making a grave mistake. Pretty much any way you cut it, Christian Scott is a righty without a changeup or curveball who dominates lefties. He owns a 29% K%, 8.4% BB%, 3.36 FIP, and 3.34 xFIP against those very hitters. While those aren’t the best figures in the league, they stand in stark contrast to when he has the platoon advantage. Versus righties, he has a 28.6% K%, 11.9% BB%, 3.12 FIP, and 4.24 xFIP. Considering the sample is small enough that home run rate has yet to stabilize, his xFIP, which assumes a league-average home run to flyball rate, is probably a better indicator of his true pitching talent. On top of getting more strikeouts and issuing fewer walks when facing lefties, even his batted-ball data is more favorable. His infield flyball rate of 13.7% is elite, while his 6.9% mark against righties is rather pedestrian, and he gets more ground balls against left-handers (34.9% vs. 30.4%). So, how is Scott doing this? It’s not luck; no, he’s cutting down lefties all because of a cutter buried in on the hands. Traditionally, the changeup and curveball are the go-to platoon-neutralizing offerings, but the cutter is another option that can be equally as devastating. When Scott debuted back in 2024, he brought the very standard three-pitch mix of fastball, slider, and an oft-used splitter. Unsurprisingly, he did fine with the platoon advantage and was downright bad without it. If he was going to get back to the bigs and stay in the rotation, he needed some way to get opposite-handed batters out. So, he did what any pitcher who struggles to pronate should do: He added a cutter, and it has completely changed his profile. Scott’s cutter isn’t superlative in terms of velocity or movement, but it pairs exceptionally with his four-seam fastball and slider in a way that gives lefties nightmares. His four-seamer is typically located at the top of the zone, with a general bias towards the right-handed batter's box. Meanwhile, his cutter is almost always up and in on lefties. Hopefully, you can already see the dilemma. Out of the hand, left-handed batters don’t know if they’re facing a fastball up and away, or a cutter that will bear in on their hands. Making matters even better, or worse if you’re a lefty facing Scott, is that the threat of his cutter causes his slider to play up as well. His sweeper/slider is an interesting pitch; it drops far less than the average comparable offering, but that makes it tunnel even better with his cutter. Functionally, Scott’s slider is his cutter’s changeup. This band of pitches all at different velocities and movement profiles causes each pitch to play well above its raw stuff. Just look at this four-pitch strikeout of Matt Olson, owner of a 142 wRC+ against righties. Pitch one (cutter inside, swinging strike) Pitch two (low sweeper, fouled off) Pitch three (fastball up and away out of the zone) Pitch four (sweeper down and in, swinging strikeout) Scott’s evolution into a lefty killer is only a half-wonderful development for the Mets. Most righties with a fastball-sweeper combination struggle to get lefties out, while dominating righties, but the opposite is true for Scott. Somehow, someway, the same characteristics that make him a nightmare against left-handers haven’t translated against righties, and it won’t be long until managers get wise and start stacking them into the lineup. However, it doesn’t take a lot of imagination to conjure up a world where Scott adds another pitch or element to his repertoire to start baffling righties as well. In fact, his biggest issue might be eminently solvable. When facing same-sided batters, he has a 55.6% first-pitch strike rate, which lags far behind his 62.6% mark against lefties. Getting strike one is a big deal, especially for Scott. When up 0-1, the handedness of the hitter largely melts away. Against lefties in 0-1 counts, he has a 35.4% K%, 6.2% BB%, and 1.56 FIP, and when facing righties, he has a 37.7% K%, 8.2% BB%, and 1.68 FIP. However, when he falls behind 1-0, the script flips. Against lefties, he has a 26.1% K%, 13.6% BB%, and 4.38 xFIP, compared to a 23.6% K%, 18.2% BB%, and 5.53 xFIP versus righties. Simply getting ahead of righties with more frequency would do Scott a world of good. He has better contact figures in and out of the zone against righties, but he cannot get them to chase as often, which leads to more walks and fewer strikeouts. Just like against lefties, Scott’s best pitch by run value has been his cutter, but he only throws it 11% of the time to right handers, compared to 22% against lefties. It might be crazy, but maybe he needs to start cutting up righties, just like the lefties. View full article
-
 Christian Scott throws right-handed, unleashes his curveball and splitter a combined 9% of the time, and leans heavily on the tried-and-true fastball-slider combination. Based on those details, it shouldn’t be too surprising to learn that out of the 340 batters he has faced this season, 214 (63%) of them have been left-handed. You can’t fault opposing managers for stacking the lineup card with left-handed sticks against a righty without a traditional platoon neutralizer, but they’re making a grave mistake. Pretty much any way you cut it, Christian Scott is a righty without a changeup or curveball who dominates lefties. He owns a 29% K%, 8.4% BB%, 3.36 FIP, and 3.34 xFIP against those very hitters. While those aren’t the best figures in the league, they stand in stark contrast to when he has the platoon advantage. Versus righties, he has a 28.6% K%, 11.9% BB%, 3.12 FIP, and 4.24 xFIP. Considering the sample is small enough that home run rate has yet to stabilize, his xFIP, which assumes a league-average home run to flyball rate, is probably a better indicator of his true pitching talent. On top of getting more strikeouts and issuing fewer walks when facing lefties, even his batted-ball data is more favorable. His infield flyball rate of 13.7% is elite, while his 6.9% mark against righties is rather pedestrian, and he gets more ground balls against left-handers (34.9% vs. 30.4%). So, how is Scott doing this? It’s not luck; no, he’s cutting down lefties all because of a cutter buried in on the hands. Traditionally, the changeup and curveball are the go-to platoon-neutralizing offerings, but the cutter is another option that can be equally as devastating. When Scott debuted back in 2024, he brought the very standard three-pitch mix of fastball, slider, and an oft-used splitter. Unsurprisingly, he did fine with the platoon advantage and was downright bad without it. If he was going to get back to the bigs and stay in the rotation, he needed some way to get opposite-handed batters out. So, he did what any pitcher who struggles to pronate should do: He added a cutter, and it has completely changed his profile. Scott’s cutter isn’t superlative in terms of velocity or movement, but it pairs exceptionally with his four-seam fastball and slider in a way that gives lefties nightmares. His four-seamer is typically located at the top of the zone, with a general bias towards the right-handed batter's box. Meanwhile, his cutter is almost always up and in on lefties. Hopefully, you can already see the dilemma. Out of the hand, left-handed batters don’t know if they’re facing a fastball up and away, or a cutter that will bear in on their hands. Making matters even better, or worse if you’re a lefty facing Scott, is that the threat of his cutter causes his slider to play up as well. His sweeper/slider is an interesting pitch; it drops far less than the average comparable offering, but that makes it tunnel even better with his cutter. Functionally, Scott’s slider is his cutter’s changeup. This band of pitches all at different velocities and movement profiles causes each pitch to play well above its raw stuff. Just look at this four-pitch strikeout of Matt Olson, owner of a 142 wRC+ against righties. Pitch one (cutter inside, swinging strike) Pitch two (low sweeper, fouled off) Pitch three (fastball up and away out of the zone) Pitch four (sweeper down and in, swinging strikeout) Scott’s evolution into a lefty killer is only a half-wonderful development for the Mets. Most righties with a fastball-sweeper combination struggle to get lefties out, while dominating righties, but the opposite is true for Scott. Somehow, someway, the same characteristics that make him a nightmare against left-handers haven’t translated against righties, and it won’t be long until managers get wise and start stacking them into the lineup. However, it doesn’t take a lot of imagination to conjure up a world where Scott adds another pitch or element to his repertoire to start baffling righties as well. In fact, his biggest issue might be eminently solvable. When facing same-sided batters, he has a 55.6% first-pitch strike rate, which lags far behind his 62.6% mark against lefties. Getting strike one is a big deal, especially for Scott. When up 0-1, the handedness of the hitter largely melts away. Against lefties in 0-1 counts, he has a 35.4% K%, 6.2% BB%, and 1.56 FIP, and when facing righties, he has a 37.7% K%, 8.2% BB%, and 1.68 FIP. However, when he falls behind 1-0, the script flips. Against lefties, he has a 26.1% K%, 13.6% BB%, and 4.38 xFIP, compared to a 23.6% K%, 18.2% BB%, and 5.53 xFIP versus righties. Simply getting ahead of righties with more frequency would do Scott a world of good. He has better contact figures in and out of the zone against righties, but he cannot get them to chase as often, which leads to more walks and fewer strikeouts. Just like against lefties, Scott’s best pitch by run value has been his cutter, but he only throws it 11% of the time to right handers, compared to 22% against lefties. It might be crazy, but maybe he needs to start cutting up righties, just like the lefties.
 -
Image courtesy of © David Richard-Imagn Images The only good part about being out of it is that you can experiment with impunity. Obviously, fans would rather be engaged in a playoff race, but that’s all business, all the time, and that means stress. With the New York Mets' trade deadline fire sale complete, they still needed to actually field a 26-man team, and that means promotions for fringe major leaguers, and none is more interesting than Jefry Yan. Yan wasted no time introducing himself in his major league debut. Called upon in the sixth inning to protect a 4-3 Mets lead, he struck out Angel Martinez looking, and then proceeded to show off the celebration that is sure to make him a cult hero. I’ll admit, I’m terrified he’s going to blow out his knee one day, but that level of exuberance is infectious, and that’s something all Mets fans could use more of these days. Yan isn’t getting his first cup of coffee just as a promotional (or literal) stunt. He’s a real borderline major leaguer thanks to some of the nastiest stuff coming out of a left hand—a sinker which averaged 99.5 MPH and a bullet-bender slider that has few, if any, peers—and the rest of his single frame showed everything good and bad about his profile. Even though his sinker didn't miss as many bats as the velocity would have you think, the three batted balls he allowed were all on the ground with an average launch angle of -9.7 degrees. Groundballs are a great way to limit damage, but after two consecutive hits, he found himself in a bit of a jam. With runners on first and second with one out, Yan loaded the bases by walking Steven Kwan. Kwan possesses an incredible batting eye, but walks are just part of Yan’s effectively wild operation. After loading the bases, Yan bore down. First, he struck out Chase DeLauter, and then he finished the frame with a groundball out to escape the jam. In one inning, the Mets were treated to the Full Jefry. Incredible stuff. Tons of ground balls. A lot of wildness. Base runner-induced panic. And an infectious joy. Now, Yan isn’t going to stay in the bigs on vibes alone, but he’s a very interesting developmental project who could yield serious returns. Before we get into Jefry Yan the pitcher, I think it’s best to understand the person. Signed out of the Dominican Republic by the Los Angeles Angels, Yan came stateside in 2014 as a 17-year-old and struggled in rookie ball. He repeated the level as an 18-year-old, but blew out and needed Tommy John surgery, ending in his release in 2016. This is where most people’s baseball stories end, and it almost did for Yan. Living in the Phoenix area, he worked whatever job he could find, with reports listing landscaping, roofing, interior design, and being a delivery driver. However, through it all, he kept playing ball. Perhaps, he believed he’d get back to bigs. Perhaps, at some level, it was catharsis. All I know is that those poor amateur Sunday league guys must have thought they’d died and gone to hell. After three and a half years out of professional baseball, Yan had sufficiently terrorized enough amateurs to earn a contract with the Miami Marlins and started his major league journey all over again. He was wild, but effective, eventually reaching AAA in 2023. Instead of toiling away as a speculative call-up, he went to Japan for the 2024 season, where he posted a 5.58 ERA in 30.2 innings. For a reliever, that’s not going to get you a major-league contract, but it did allow him to find another interested club. In 2025, he latched on with the Colorado Rockies. His AAA performance was less than stellar. A 7.28 ERA in 29.2 innings is never going to be enough to get a shot, even for a team as moribund as the Rockies. Heading into his age-29 season in 2026, he got another opportunity with the Mets. While his walk rate remained above 15% (an almost unplayable figure), his strikeouts surged to 39.5% in AA and 50.8% in AAA. To go from out of the game to the highest level is an accomplishment in its own right. If last night’s inning is his lone MLB appearance, he’ll have defied the odds, and Yan knows that. His signature jump celebration is an expression of just how happy and lucky he is to be there, on that mound, hurling a leathery orb. While Jefry Yan’s human interest story is riveting on its own, his ability to pitch is just as intriguing. It’s one game and 24 pitches, but Fangraphs’ PitchingBot thinks he is armed with some of the best stuff, and worst control, in the entire league. Using the 80-20 scouting scale, PitchingBot takes a pitch’s velocity and movement, among other characteristics, and grades it based upon likely outcome. Yan’s sinker earned a 72, tied for the 15th-best grade among pitchers to throw one inning, and his slider earned a 68, tied for third. His overall stuff score of 64 ranks sixth, but his command score of 39 is one of the lowest in the league. The selling point here is pretty simple. Yan is going to strike guys out. He’s going to get ground balls. If he can simply throw an acceptable amount of strikes, he’ll be a real part of a bullpen. It’s a small sample, but the Mets were able to coax a career-high 50.8% first-pitch strike rate from him in AAA, and he did register a first-pitch strike of 66.7% in his lone inning of big league work. I wouldn’t bet on him ever throwing a league-average number of strikes, but it’s not impossible to dream. The Orioles famously got Felix Bautista to throw enough strikes to be one of the most dominant relievers in the sport, and they did the same thing with Yennier Cano. There is a history of relievers with big stuff finding the zone later in their careers and becoming legit late-inning weapons. The odds are stacked against Jefry Yan ever throwing enough strikes, but so were his odds of reaching the majors back in 2021. So yes, his appearances will oscillate between the sublime and sardonic, but I’ll still enjoy the ride. One jump at a time. View full article
-
Jefry Yan Will Jump Off the Mound Right Into Mets Fans' Hearts
N.B. Lindberg posted an article in Mets
 The only good part about being out of it is that you can experiment with impunity. Obviously, fans would rather be engaged in a playoff race, but that’s all business, all the time, and that means stress. With the New York Mets' trade deadline fire sale complete, they still needed to actually field a 26-man team, and that means promotions for fringe major leaguers, and none is more interesting than Jefry Yan. Yan wasted no time introducing himself in his major league debut. Called upon in the sixth inning to protect a 4-3 Mets lead, he struck out Angel Martinez looking, and then proceeded to show off the celebration that is sure to make him a cult hero. I’ll admit, I’m terrified he’s going to blow out his knee one day, but that level of exuberance is infectious, and that’s something all Mets fans could use more of these days. Yan isn’t getting his first cup of coffee just as a promotional (or literal) stunt. He’s a real borderline major leaguer thanks to some of the nastiest stuff coming out of a left hand—a sinker which averaged 99.5 MPH and a bullet-bender slider that has few, if any, peers—and the rest of his single frame showed everything good and bad about his profile. Even though his sinker didn't miss as many bats as the velocity would have you think, the three batted balls he allowed were all on the ground with an average launch angle of -9.7 degrees. Groundballs are a great way to limit damage, but after two consecutive hits, he found himself in a bit of a jam. With runners on first and second with one out, Yan loaded the bases by walking Steven Kwan. Kwan possesses an incredible batting eye, but walks are just part of Yan’s effectively wild operation. After loading the bases, Yan bore down. First, he struck out Chase DeLauter, and then he finished the frame with a groundball out to escape the jam. In one inning, the Mets were treated to the Full Jefry. Incredible stuff. Tons of ground balls. A lot of wildness. Base runner-induced panic. And an infectious joy. Now, Yan isn’t going to stay in the bigs on vibes alone, but he’s a very interesting developmental project who could yield serious returns. Before we get into Jefry Yan the pitcher, I think it’s best to understand the person. Signed out of the Dominican Republic by the Los Angeles Angels, Yan came stateside in 2014 as a 17-year-old and struggled in rookie ball. He repeated the level as an 18-year-old, but blew out and needed Tommy John surgery, ending in his release in 2016. This is where most people’s baseball stories end, and it almost did for Yan. Living in the Phoenix area, he worked whatever job he could find, with reports listing landscaping, roofing, interior design, and being a delivery driver. However, through it all, he kept playing ball. Perhaps, he believed he’d get back to bigs. Perhaps, at some level, it was catharsis. All I know is that those poor amateur Sunday league guys must have thought they’d died and gone to hell. After three and a half years out of professional baseball, Yan had sufficiently terrorized enough amateurs to earn a contract with the Miami Marlins and started his major league journey all over again. He was wild, but effective, eventually reaching AAA in 2023. Instead of toiling away as a speculative call-up, he went to Japan for the 2024 season, where he posted a 5.58 ERA in 30.2 innings. For a reliever, that’s not going to get you a major-league contract, but it did allow him to find another interested club. In 2025, he latched on with the Colorado Rockies. His AAA performance was less than stellar. A 7.28 ERA in 29.2 innings is never going to be enough to get a shot, even for a team as moribund as the Rockies. Heading into his age-29 season in 2026, he got another opportunity with the Mets. While his walk rate remained above 15% (an almost unplayable figure), his strikeouts surged to 39.5% in AA and 50.8% in AAA. To go from out of the game to the highest level is an accomplishment in its own right. If last night’s inning is his lone MLB appearance, he’ll have defied the odds, and Yan knows that. His signature jump celebration is an expression of just how happy and lucky he is to be there, on that mound, hurling a leathery orb. While Jefry Yan’s human interest story is riveting on its own, his ability to pitch is just as intriguing. It’s one game and 24 pitches, but Fangraphs’ PitchingBot thinks he is armed with some of the best stuff, and worst control, in the entire league. Using the 80-20 scouting scale, PitchingBot takes a pitch’s velocity and movement, among other characteristics, and grades it based upon likely outcome. Yan’s sinker earned a 72, tied for the 15th-best grade among pitchers to throw one inning, and his slider earned a 68, tied for third. His overall stuff score of 64 ranks sixth, but his command score of 39 is one of the lowest in the league. The selling point here is pretty simple. Yan is going to strike guys out. He’s going to get ground balls. If he can simply throw an acceptable amount of strikes, he’ll be a real part of a bullpen. It’s a small sample, but the Mets were able to coax a career-high 50.8% first-pitch strike rate from him in AAA, and he did register a first-pitch strike of 66.7% in his lone inning of big league work. I wouldn’t bet on him ever throwing a league-average number of strikes, but it’s not impossible to dream. The Orioles famously got Felix Bautista to throw enough strikes to be one of the most dominant relievers in the sport, and they did the same thing with Yennier Cano. There is a history of relievers with big stuff finding the zone later in their careers and becoming legit late-inning weapons. The odds are stacked against Jefry Yan ever throwing enough strikes, but so were his odds of reaching the majors back in 2021. So yes, his appearances will oscillate between the sublime and sardonic, but I’ll still enjoy the ride. One jump at a time.
 -
Image courtesy of © Vincent Carchietta-Imagn Images No one wants to be the biggest seller at the trade deadline because it usually means you’re the biggest loser. And while the New York Mets don’t have the worst record in baseball—at least, not yet—they’ve undoubtedly had the most disastrously depressing season in baseball. They entered the season earmarked as a 90-win team and find themself on pace for 67. Taking the old adage, “everyone will win 54 games and lose 54 games; it’s what you do with the other 54 that matters,” literally, the Mets went from a team expected to go 36-18 to one tracking to go 13-41. With that thought in mind, the 2026 Mets were functionally two teams: the awful one that they are, and the great one that they should have been. And this juxtaposition helps explain their overall deadline strategy. Starting with the players the Mets moved, one thing is very clear: they believe they’ll be good again in 2027. Of the eight players the Mets moved, four were relievers, six were on expiring contracts, and that doesn’t include Clay Holmes’ player option for 2027. Functionally, the only guy they moved who for sure had a contract for the 2027 team was Luke Weaver. I’m sure some fans wished they had kept Weaver, but there is never a bad time to trade a reliever. For whatever reason, relievers are as fickle as the wind. Weaver is pitching well now, and the Pirates were willing to give up an interesting prospect for him. You do that deal every day when you’re already out of the playoff mix. While that’s part and parcel for a deadline fire sale, it’s informative because of who the Mets could have moved. Luis Robert Jr., who has a team option for 2027, was in the rumor mill. As were Francisco Lindor and Alvarez. Sure, the Mets have a bunch of guys on seemingly immovable contracts, but I’m sure they could have found a home for Sean Manaea and Devin Williams if they were willing to eat a sizable amount of money. Instead, the team decided to almost exclusively move rentals, which means they’re still cautiously optimistic about the 2027 team. It may sound crazy to run back such a disappointing team, but it’s probably the right idea. Juan Soto is in the middle of his prime. Lindor is still excellent when healthy. McLean looks to be the real deal. And the blood sacrifice New York made trading the Mets’ soul for a Knicks championship run will hopefully have been fulfilled. Giving this core one more chance to live up to its potential is more prudent than strip mining the roster down to the core. On the prospect side of the equation, the Mets are betting big on their pitching development. Five of the 12 prospects they landed are pitchers, and four of them have the note, “Stuff, command issues,” next to them in my spreadsheet. The Mets have recently had success developing pitchers, so I think this is a good strategy. The chances that any of them turn into a solid major league starter are pretty small, but as this deadline showed, contenders need relievers, and Chayce McDermott, Luke Gabrysh, Gabe Davis, and Zach Franklin could all be pretty decent. On the position player side, the Mets were a little more scattershot. Landing Jefferson Rojas was one of the best moves of the deadline, and he could help the big team as early as next season. He’s unlikely to develop into a star—which is the case for just about every prospect—but the organization could have sorely used another competent infielder this season. And if he ends up being blocked, well, he’s a top-100 prospect to dangle for something you need more. After Rojas, the Mets picked up two higher-variance prospects in Sammy Stafura and Aidan Smith. Stafura projects to stick at short and has suddenly started hitting for power, but at the cost of contact. His hit tool was already a bit suspect, but a viable shortstop defender who can take a walk and hit 25 home runs is a valuable, if highly frustrating, major league contributor. His play bears monitoring, but the Mets might have identified an arrow-up prospect a bit quicker than the industry, and a utility guy with some pop is always nice to have hanging around the 40-man. Smith is a pure reclamation project, which is never a good sign for a 22-year-old who has yet to make it to AA. He’s a great athlete and has real power projection, but he hasn’t hit well this season and has yet to get his strikeout rate below 30% in High-A. He has a chance to stick in center, but unless his contact issues get remedied or he becomes an elite defender, he’ll probably get stuck in AA. However, guys who can play center with some level of power are always worth a lottery ticket. After those three, the Mets did well to land guys who should at least be able to navigate their way to AAA. Emilien Pitre is going to hit well enough to at least get a cup of coffee. John Spikerman can play center and is patient. And Bruin Agbayani is far away but has a solid hit-tool foundation. In general, the Mets appear to have indexed more towards higher-upside, higher-variance prospects, which I think is the right decision. They operate in a different financial realm than most of the league, which means they don’t need their farm system to constantly churn out average MLB players. If the Mets need a right fielder, they can sign or trade for an established one. That costs more money, but it also means they don’t necessarily need someone in AAA ready to step in. While it’s great to produce role players like a turn-of-the-century assembly line, the Mets farm system should be aiming to produce two things: stars, and players you package for immediate upgrades. I think the front office did a good job identifying players who could benefit from their developmental strengths, securing a few high-upside position players, and also getting guys who should be useful enough in the high minors that they’ll facilitate their own 2027 trade deadline acquisitions. As this deadline showed, a few 35-grade prospects can go a long way. View full article
