


Mets Video
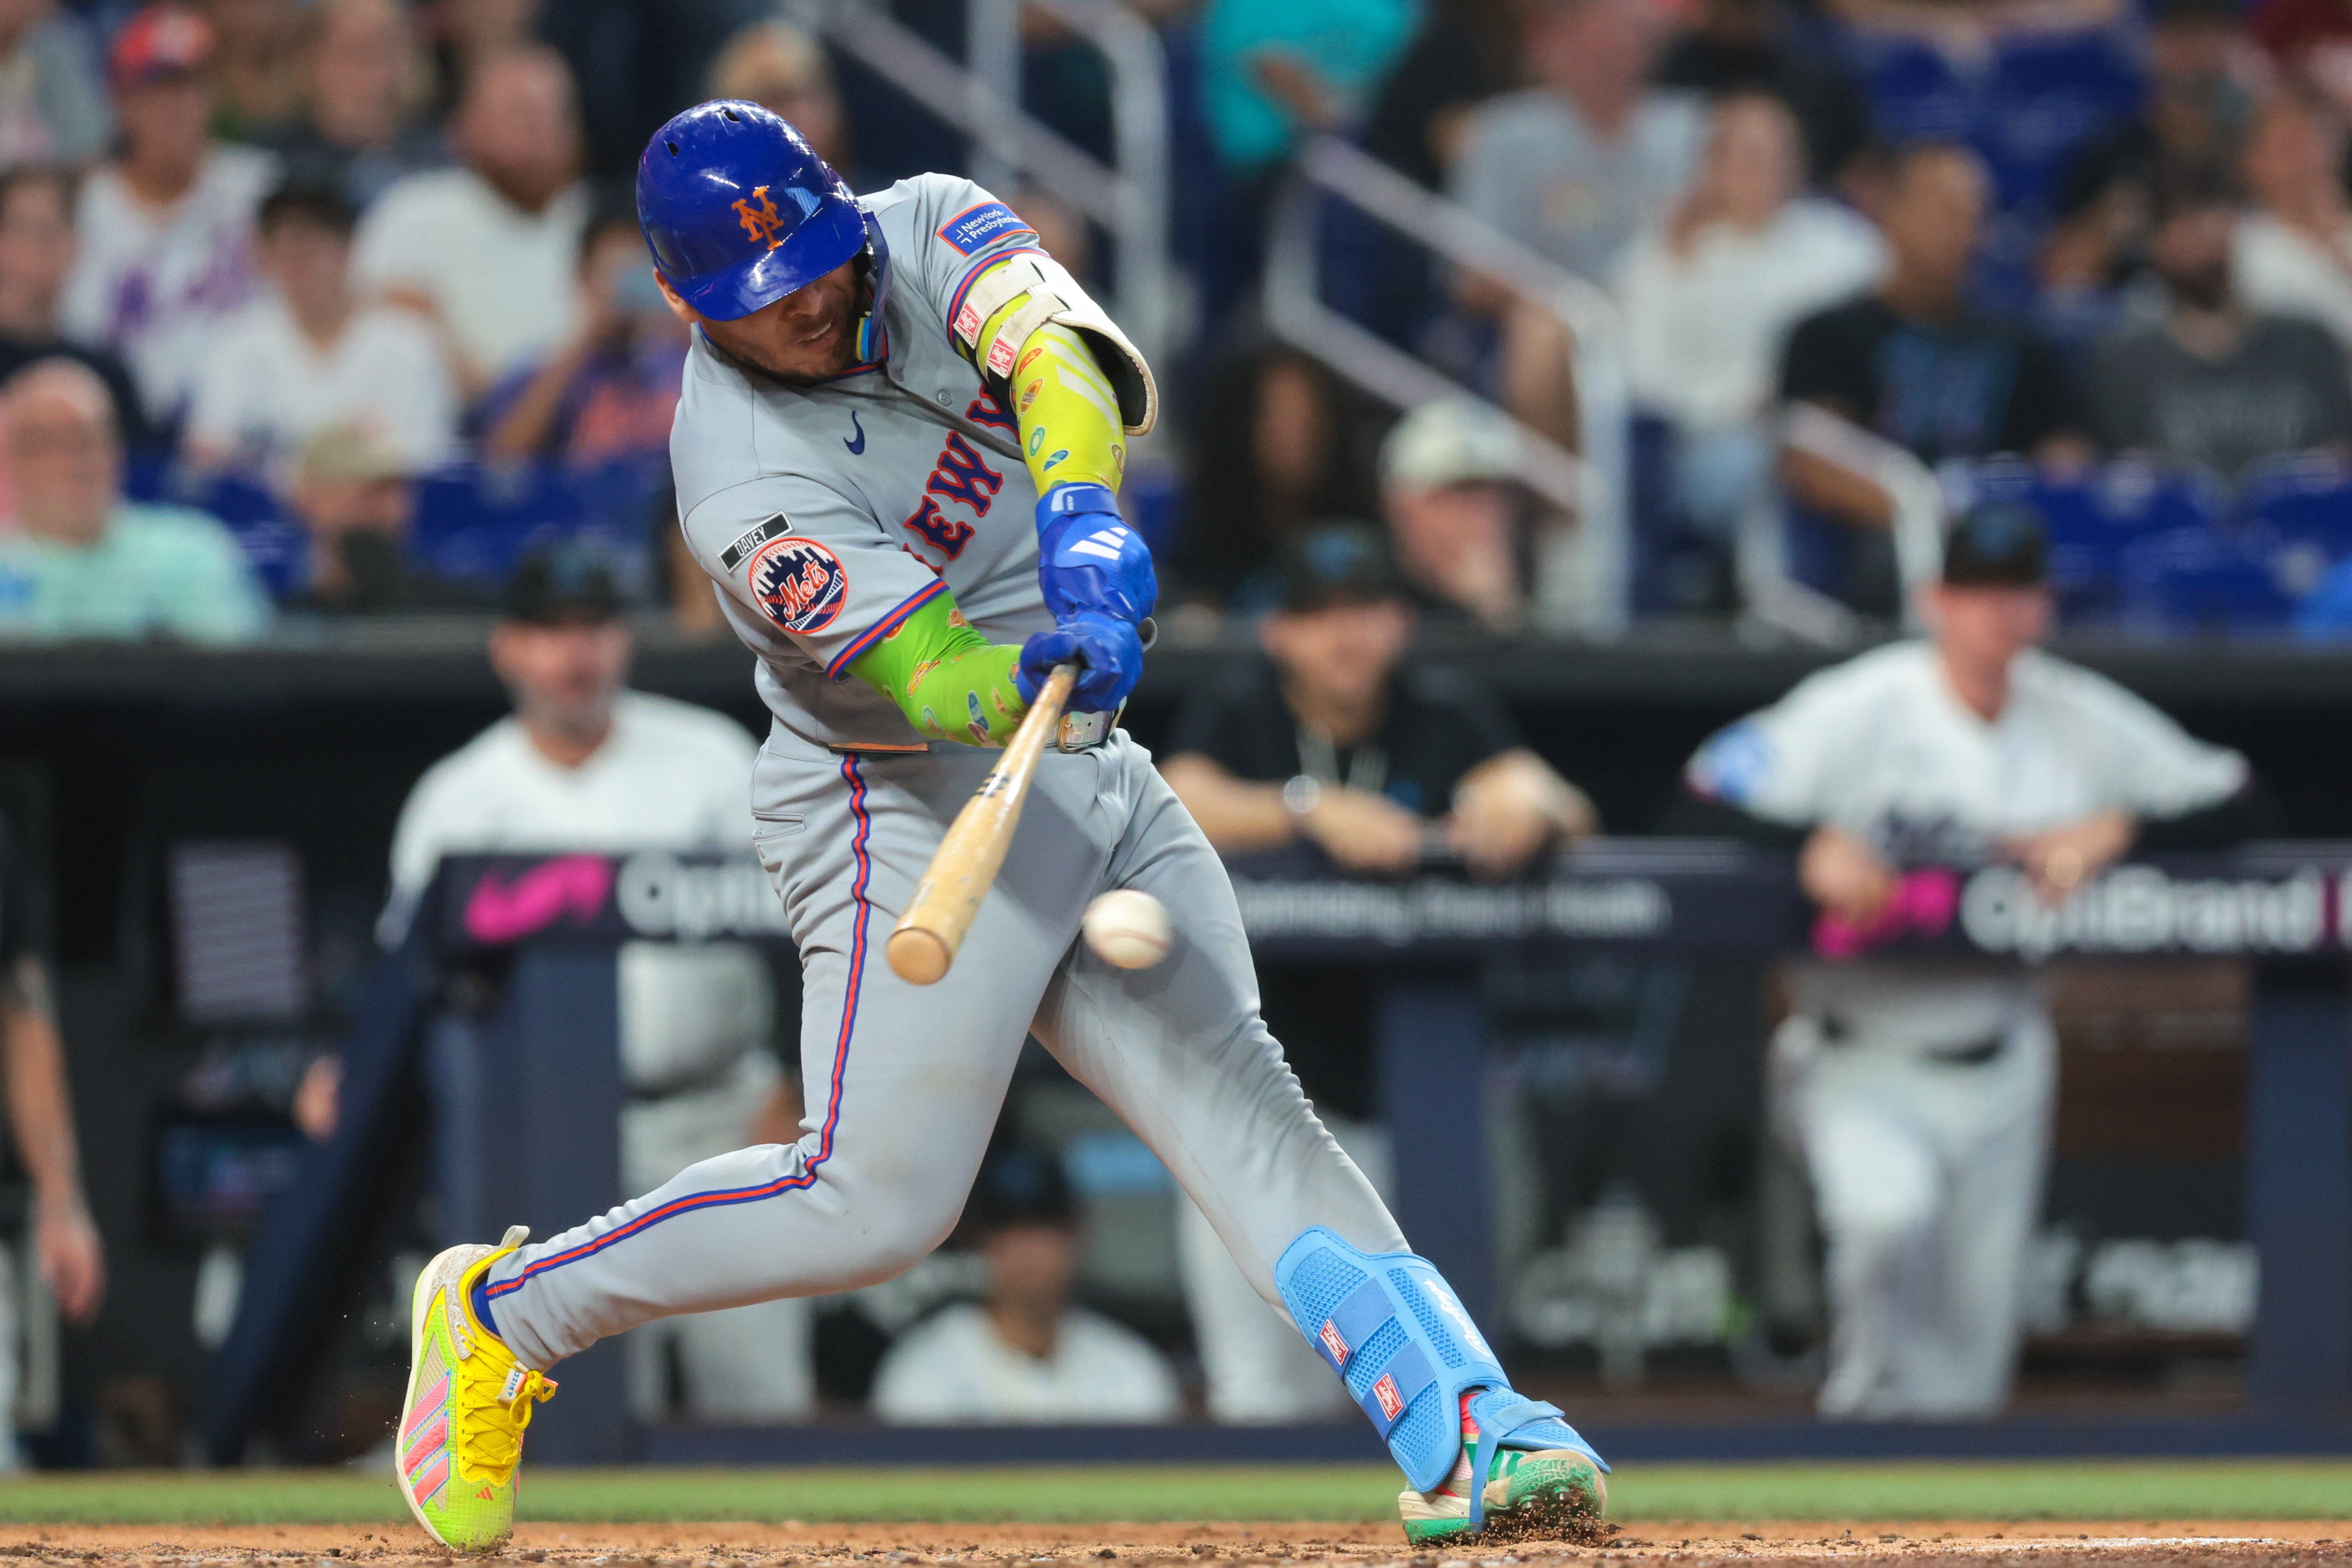
There was a moment in late July when Francisco Alvarez had found his best rhythm at the plate. Remember, he had suffered a right meniscus tear on May 12, 2026. He underwent surgery two days later and, although the New York Mets estimated that the absence would last between six and eight weeks, he returned in just four, after a brief rehab assignment. Then the Mets became sellers at the trade deadline, and the season took a turn from that moment on. The pressure of competing to reach the postseason had disappeared, which took away a great deal of pressure when facing the rest of the schedule.
After posting a 124 wRC+ in June, Álvarez put together his best numbers in July when he hit .267/.405/.433, with a 138 wRC+ and a 17.6 BB% rate, his best rate of any month this season. Expectations seemed high for the rest of the season, especially after seeing how he was responding offensively after overcoming the injury that sidelined him in May. However, August arrived and Álvarez’s problems at the plate began to become more frequent. His strikeout rate jumped from 26.3% to 41.5%, his slugging fell 148 points, and his 116 wRC+ dropped to 51.
The regression has not come from a decline in Álvarez’s quality of contact or a drastic change in his aggressiveness. His hard-hit rate between March/April and July was 39.6%, and since August it has risen slightly to 41.40%. Now, regarding his plate discipline, there are interesting details to highlight.
| Period | O-Swing% | Z-Swing% | O-Contact% | Z-Contact% | K% |
|---|---|---|---|---|---|
| ABR - JUL | 34.7% | 63.1% | 55.6% | 82.1% | 26.3% |
| AUG - SEP | 34.0% | 61.0% | 48.2% | 76.5% | 41.5% |
As you can see here, Álvarez has maintained similar trends in both stretches regarding his swing decisions. The change has come in effectiveness, as he has fallen to a 7.4% rate in O-Swing% and 5.6% in Z-Swing%. This reduction in the reach of his swing leads us to the most concerning situation of all, his disproportionate 15.2% increase in his strikeout rate. Álvarez is having one of the worst seasons of his career against left-handed pitchers, posting just a 70 wRC+ this year, much of which is owed to his strikeout rate of 34.3% (which is nearly five percentage points above the 29.6% he has against right-handers).
The turning point that illustrates the main breakdown is Álvarez’s terrible slump against fastballs. You probably still remember his 2023 season at age 21, when he became a revelation and hit 25 home runs. Of those, 15 came while crushing fastballs. His strikeout rates have always been high against velocity, and pitchers know it, but Álvarez used to compensate for the strikeouts with elite contact and high production.
Part of that story has changed this season, and it has been the biggest problem for the Venezuelan catcher at the plate.
| Season | PA | HR | HR/PA | BA | SLG | xwOBA | Whiff% | K vs FB / Total K |
|---|---|---|---|---|---|---|---|---|
| 2022 | 8 | 0 | 0.0% | .167 | .333 | .427 | 31.3 | 25.0% |
| 2023 | 226 | 15 | 6.6% | .215 | .485 | .345 | 26.5 | 40.9% |
| 2024 | 168 | 7 | 4.2% | .310 | .531 | .369 | 22.3 | 43.0% |
| 2025 | 145 | 6 | 4.1% | .301 | .488 | .372 | 28.3 | 45.2% |
| 2026 | 211 | 7 | 3.3% | .230 | .372 | .331 | 31.4 | 55.4% |
The statistics are revealing: his whiff rate is at its highest point ever, his slugging fell from the minimum of .485 that he recorded in qualified seasons, and his home run rate also dropped to its lowest point. The K vs FB/Total K statistic shows us Álvarez’s average strikeouts against fastballs compared to his total strikeouts, and this has also been the worst year with a concerning rise to 55.4%. That means the league is striking him out exclusively with fastballs far more often than in 2025, when he had set his previous worst personal record in that regard.
Although his injury at the beginning of the season is an unavoidable point here, Álvarez had shown that he was back, but the long-term results have not been sustainable. For the Mets, the impact of Álvarez’s regression has not been as catastrophic because Luis Torrens has had one of his best seasons in recent years. Torrens has posted a 101 wRC+ and 2.2 fWAR with nine home runs and 40 RBIs in 87 games, surpassing Álvarez’s contribution, who has 15 home runs and 37 RBIs, but has fallen to a 97 wRC+ and 1.4 fWAR.
In terms of contribution, Torrens has also been superior with runners in scoring position, producing a 128 wRC+ compared to Álvarez’s mark of 68 (and he has not been able to hit home runs in those situations). Torrens’ case becomes even more unusual, as he is the hitter with the biggest difference in the entire league in terms of wRC+ in RISP situations compared to his production with the bases empty.
In terms of defense as catchers, Torrens also has better results than Álvarez in terms of run prevention, allowing a 3.68 ERA compared to 4.61. Opponents have averaged a .683 OPS when Torrens is catching, compared to .747 with Álvarez. In addition, Torrens is also ahead in Catcher Framing Runs (6 to 3) and Catcher’s CS Above Average (4 to 2), although both belong to the elite group of catchers this season.
Amid the chaos that Álvarez’s season has become since August, the good news for the Mets is that Torrens is emerging as a bona fide star. I still believe that Álvarez can be more consistent and deserves to be viewed as the long-term starter at the position, but it's impossible not to cede a little confidence to his veteran backup as the two trend in opposite directions down the stretch.





Recommended Comments
There are no comments to display.
Create an account or sign in to comment
You need to be a member in order to leave a comment
Create an account
Sign up for a new account in our community. It's easy!
Register a new accountSign in
Already have an account? Sign in here.
Sign In Now