


Mets Video
They say money can’t buy you happiness, love, friends, and, apparently, pennants. Outside of the Los Angeles Dodgers, who are back in the NLCS for the third consecutive season, the league’s most expensive teams either failed to make the postseason or have been eliminated prior to the championship series.
|
|
|
|
|
|
|
|
|
|
|
|
|
|
|
|
|
|
|
|
|
|
|
|
|
|
|
|
|
|
|
|
|
|
|
|
|
|
|
|
|
|
|
|
|
|
|
|
|
|
|
|
|
|
|
|
|
|
|
|
|
|
|
|
|
|
|
|
|
|
|
|
|
|
|
|
|
|
|
|
|
|
|
|
|
|
|
|
|
|
|
|
|
|
|
|
|
|
|
|
|
|
|
|
|
|
|
|
|
|
|
|
|
|
|
|
|
|
|
|
|
|
|
|
|
|
|
|
|
|
|
|
|
|
|
|
|
|
|
|
|
|
|
|
|
|
|
|
|
|
|
|
|
|
|
While this isn’t the topic of this article, just know that if the owners lock the players out for a salary cap, it isn’t about competitive balance. The linear correlation between total payroll and wins in 2026 was 0.299, which is very weak.
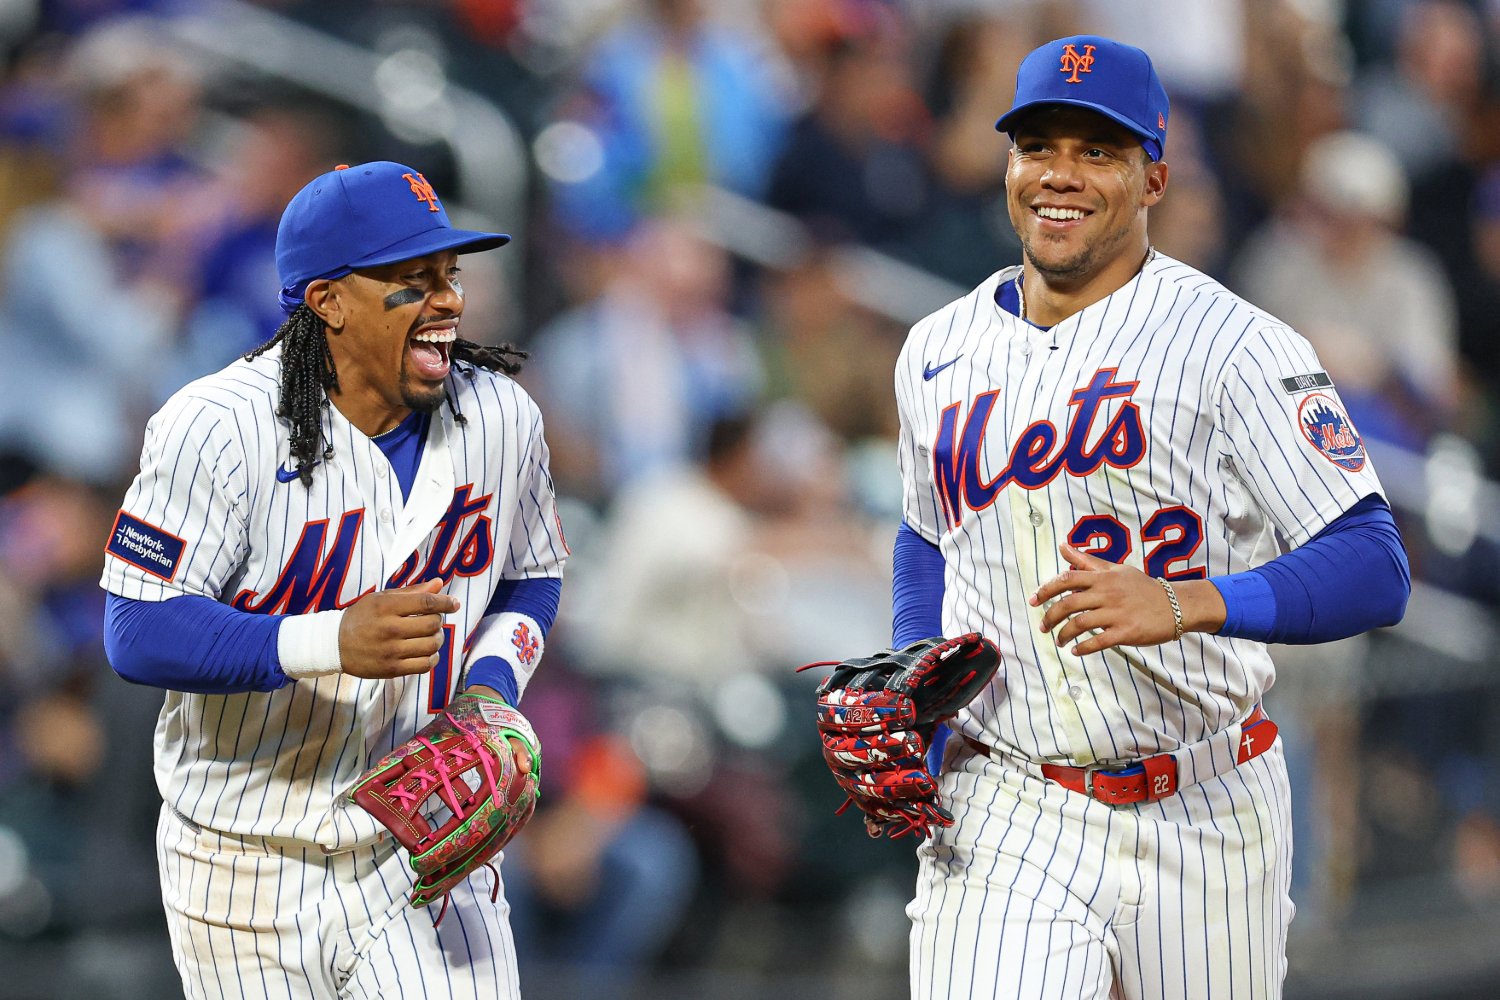
Now, none of this has stopped people from trolling the Mets, who, for the low, low price of $346 million, won 74 games. Their $4.685 million per win was by far the highest in the league, and the supposed culprits of this extreme inefficiency were none other than Juan Soto and Francisco Lindor.
When a team this expensive fails this spectacularly, it’s easy to blame the highest earners, but that’s not exactly what went wrong with the 2026 Mets. That being said, Lindor and Soto aren’t blameless; the pair earned a combined $95.975 million and produced a measly 5.5 fWAR. However, that had far more to do with injury.
If Soto and Lindor had hit 158 games played, instead of 111 and 105 respectively, they would have combined for 7.72 fWAR if they had played at their seasonal fWAR pace. When you throw Bo Bichette in the mix, who earned $42 million and produced 1.9 fWAR, things do get worse. All told, the Mets’ three highest earners took home $137.975 million in salary and produced 7.2 fWAR.
|
|
|
|
|
|
|
|
|
|
|
|
|
|
|
|
|
|
|
|
|
|
|
|
|
|
|
|
|
|
|
|
|
|
|
|
|
|
|
|
|
|
|
|
|
Stars need to be stars, and the Mets’ three position-player stars fell short because of injury in Lindor and Soto’s case and underperformance in Bichette’s. But that’s not why the Mets won 74 games despite a $350 million payroll.
What doomed the Mets was that their middle class of earners absolutely stunk. The Mets had six players who earned between $10 million and $20 million, for a total of $116.112 million in salary. That half-dozen cohort combined to produce an unfathomable -0.2 fWAR.
|
|
|
|
|
|
|
|
|
|
|
|
|
|
|
|
|
|
|
|
|
|
|
|
|
|
|
|
|
|
|
|
Obviously, Jorge Polanco’s -1.4 fWAR looms large, but when Sean Manaea’s 1.0 fWAR leads the pack, this level of putridness is still a group effort. While the Mets’ three highest earners have received the most criticism, their average of $19.163 million per fWAR looks like a downright bargain compared to these laggards. If the Mets’ middle earners had produced at that allegedly reprehensible pace, they would have combined for an fWAR of 6.06.
To put in perspective how much damage the dismal half-dozen caused, the Mets spent $32.68 million on players who didn’t play for them. Somehow, some way, that money led to more fWAR. If you combine that dead money with their vengeful zombie money, the Mets spent $148.8 million for -0.2 fWAR.
Now, nothing we've discussed has been an efficient use of dollars, but it's clear that the Mets’ season didn’t end in disaster solely because Juan Soto and Francisco Lindor stunk. The main reason the Mets fell short of their financial expenditures is that their middle class collapsed, and their stars weren’t bright enough to offset it.
On the bright-ish side, the Mets’ lower earners were actually relatively productive. Among players who earned between $1 million and $9.9 million, that group of 13 produced 10.6 fWAR for a total cost of $53.4 million. And the 21 players who took home less than $1 million racked up 13.8 fWAR for $13.5 million.
Now, the pre-arbitration and arbitration system is specifically designed to churn out value production—hence the complete farce that a salary cap has much to do about competitive balance—but the Mets did solidly here, which portends a brighter future.
Nolan McLean, Carson Benge, A.J. Ewing, and Christian Scott, who accounted for 11.9 of their sub-million 13.8 fWAR, won’t be cheap forever, but they will be cheap for the next three to four seasons. With continued growth, a bounce back from their stars, and hopefully a rebuilt middle class, the Mets can put their financial resources to good use, instead of burning a mountain of cash like they're the Joker in The Dark Knight.





Recommended Comments
There are no comments to display.
Create an account or sign in to comment
You need to be a member in order to leave a comment
Create an account
Sign up for a new account in our community. It's easy!
Register a new accountSign in
Already have an account? Sign in here.
Sign In Now